
Map legends are important in thematic mapping, but KML/Google Earth has no build-in legend support (except the list view of map elements). I think the best workaround is to add a legend using the KML ScreenOverlay element. Unfortunately, this element only supports image overlays and not HTML layers. This makes it harder to create a dynamic legend that changes with your data.
Still, there are options: GD is an open source graphics library for dynamic creation of images. Using this library you can build a legend by adding colour scales and text to an image canvas. GD is written in C with bindings available for various languages.
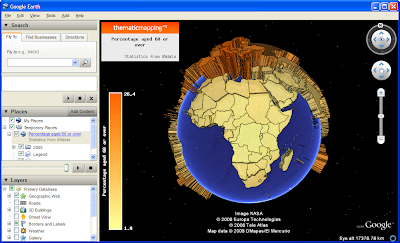 The legend and map title shown in this screenshot are created using PHP-GD image functions, stored in a KMZ archive as PNG images, and added as screen overlays. You can download the KMZ file here.
Still, there are options: GD is an open source graphics library for dynamic creation of images. Using this library you can build a legend by adding colour scales and text to an image canvas. GD is written in C with bindings available for various languages.
The legend and map title shown in this screenshot are created using PHP-GD image functions, stored in a KMZ archive as PNG images, and added as screen overlays. You can download the KMZ file here.
Comments
wanted to email you to discuss your work but couldn't find a link. We've been doing some thematic map development for GE in a humanitarian context but with an emphasis on offline delivery.
http://googleearthdesign.blogspot.com/2008/05/tmapper-thematic-mapping-tool.html
I think your approach is more sophisticated but difficult to deliver offline.
Would be interested to discuss your work with you.
Rich
Please contact me on bjorn@thematicmapping.org
It's correct that my approach requires a web server (which could be offline).
I needed to do something much like what you've done, but used a different solution:
I created my legend as an html table, then ran it through html2ps tool on my linux box, then ran the ps file through ImageMagicks convert tool to create the final jpg that I had named in my kml in the screen overlay section. I'm generating time sequenced nutrient maps of vegetation in an area in Alaska. Although im using a web server to provide the interface, the code does not need a web server to operate. It's simply php, some unix tools and ImageMagick.
Darrell Blodgett
Reindeer Research Program
fndsb@uaf.edu