
The first thematic map examples

Now that we have world borders, a spatial database, some PHP code and statistics, - it's time to start the fun stuff: making thematic maps! I've started width choropleth maps (shaded polygons), and the first results can be seen by downloading this KML to Google Earth, or by looking at the images below.

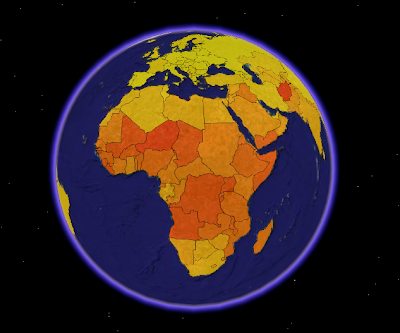
This screenshot from Google Earth is a visualisation of the world fertility (children per woman) 2000-2005. Darker colour means higher fertility. Afghanistan has the highest fertility in the world (7,5 children per woman). The data are unclassified, the countries are coloured according to their fertility value on a colour range.

On this image, the fertility values are also represented by the height of the country polygons. I find it easier to see differences between countries by using this visualisation technique.


View Larger Map

KML is not the optimal format for choropleth mapping in Google Maps. My KML file was too big, so I had to generate a new showing only African countries.

Fertility data are from UNdata. World borders can be downloaded on this site. I can not guarantee that the areas represented by statistical values and the mapped areas are identical, since the data are from two different sources.

Comments

Mano Marks said…
This is really interesting, and a great use of KML and Google Earth. And I think the way you've done the polygons is really attractive.

You might think about, if you're having trouble with files that are too large for Maps, going with a view-based NetworkLink, which queries a script based on the view parameters. This works in Maps and Earth.
Anonymous said…
Great work, Bjørn! Your blog is an inspiration! I'm thinking about creating 3D bars like this with cartodb data on a regular leaflet/mapbox map. One can achieve 2.5D with a simple CCS transform: rotateX(45deg), and then one could, perhaps, add 3D bars into the mix. Any ideas, or have you seen this?
@kosjoli (appreciate if you ping me! :)
Bjørn Sandvik said…
Previously I've only used KML to create 3D bars, but today I would probably use D3.js or three.js.

Popular posts from this blog

Creating a WebGL Earth with three.js

This blog post will show you how to create a WebGL Earth with three.js , a great JavaScript library which helps you to go 3D in the browser. I was surprised how easy it seemed when reading a blog post  by Jerome Etienne . So I decided to give it a try using earth textures  from one of my favourite cartographers, Tom Patterson . WebGL is a JavaScript API for rendering interactive 3D graphics in modern web browsers without the use of plug-ins. Three.js is built on top of WebGL, and allows you to create complex 3D scenes with a few lines of JavaScript. If your browser supports WebGL you should see a rotating Earth below: [ Fullscreen ] To be able to display something with three.js, you need three things: a scene, a camera and a renderer. var width  = window.innerWidth,     height = window.innerHeight; var scene = new THREE.Scene(); var camera = new THREE.PerspectiveCamera(45, width / height, 0.01, 1000); camera.position.z = 1.5; var rende...

Terrain building with three.js

In my last blog post , we converted a digital elevation model (DEM) to a WebGL-friendly format ( i.e. easy to transfer and parse by JavaScript in the browser). In this blog post, we'll use the elevation data to build a terrain mesh with three.js .  First we need to transfer the terrain data to the browser. The elevation values are stored in a binary file as 16-bit unsigned integers. This page explains how you can send and receive binary data using JavaScript typed arrays. I've created a TerrainLoader by adapting the  XHRLoader . You can also use this function: function loadTerrain(file, callback) {   var xhr = new XMLHttpRequest();   xhr.responseType = 'arraybuffer';   xhr.open('GET', file, true);   xhr.onload = function(evt) {         if (xhr.response) {       callback(new Uint16Array(xhr.response));     }   };     xhr.send(null); } Loading elevation data with the Terrai...

Creating 3D terrains with Cesium

Previously, I’ve used three.js to create 3D terrain maps in the browser ( 1 , 2 , 3 , 4 , 5 , 6 ). It worked great for smaller areas, but three.js doesn’t have built-in support for tiling and advanced LOD algorithms needed to render large terrains. So I decided to take Cesium for a spin. Cesium is a JavaScript library for creating 3D globes and 2D maps in the browser without a plugin. Like three.js, it uses WebGL for hardware-accelerated graphics. Cesium allows you to add your own terrain data, and this blog post will show you how. Impressed by the terrain rendering in @CesiumJS - with a 10m elevation model for Norway! Farewell Google Earth. pic.twitter.com/RQKvfu2hBb — Bjørn Sandvik (@thematicmapping) October 4, 2014 Compared to  the dying Google Earth plugin , it's quite complicated to get started with Cesium. The source code is well documented and the live coding Sandcastle is great, but there is a lack of tutorials  and my development slows down when ...