Wednesday 26 March 2008

Making maps with Google Chart API

A new version of Google Chart API was released last week. The most important change was the removal of the limit on the number of daily requests. I also noticed that a thematic map feature was added, and this is the result after some tweaking hours:

The map above shows the number of Internet user in the world (proportional). Only unclassified choropleth maps are so far supported by the API. Right-click on the image and select Properties to see the URL generating the map image. The URL contains country codes and values for most of the world countries, but the length (1308 characters) is still within the 2083 limit.

You'll find a quick tutorial for making maps with Google Chart API on this page. So far, I find the mapping feature of Google Chart API more suitable for "country highlighting" than for thematic mapping. The maximum size for maps (440 by 220 pixels) is too restrictive, as a world map needs more detail. I also miss a map legend, so the map reader can spot which colours represent high/low values. Still, it's a good start, and a greater advantage of Google Chart API is the possibility to put charts on top of maps.

UPDATE 6 APRIL 2008: A brief tutorial of thematic mapping with Google Charts API

Data source for Internet users: UNdata

Saturday 15 March 2008

Generating map tiles with GDAL2Tiles

GDAL2Tiles is a command line tool that allows easy publishing of raster maps on the Internet. The raster image is converted into a directory structure of small tiles which you can copy to your webserver. GDAL2Tiles is included in GDAL/OGR 1.5.0 release.
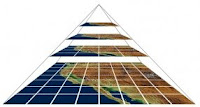
GDAL2Tiles is compatible with the Tile Map Service (TMS) Specification. TMS has been proposed as a standardised way in which map tiles are requested by clients and how servers describe their holdings. TMS is not an "official standard" and is currently managed by the Open Source Geospatial Foundation (OSGeo). The specification is based on multi-resolution image pyramids. Tile maps are composed of a set of scale-appropriate cartographic renderings, each divided up into regularly spaced image tiles.

If the supplied raster map uses EPSG:4326 projection, GDAL2Tiles also generates necessary metadata for Google Earth (KML SuperOverlay).

When the user is zooming or panning tile maps, only the tiles not currently in memory are requested from the TMS server. No special server software is needed if all map tiles are pregenerated.

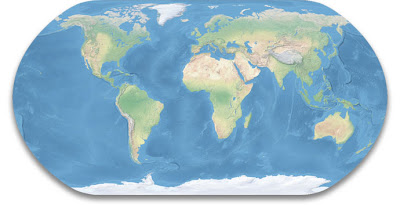
I’m here showing how you can use GDAL2Tiles to generate map tiles of Tom Patterson’s Natural Earth II. This is a beautiful raster map that portrays the world environment in an idealised manner with little human influence. The map can be downloaded on this page. I’m here using version 2C.
I start by using gdal_translate to georeference the map image:
gdal_translate -a_srs EPSG:4326 -gcp 0 0 -180 90 -gcp 16200 0 180 90 -gcp 16200 8100 180 -90 NE2_modis3.jpg NE2_modis3.tif

The image should now have the correct projection (EPSG:4326), but GDAL2Tiles was not generating the KML SuperOverlay before ran this command:

gdalwarp -t_srs EPSG:4326 NE2_modis3.tif NE2_modis3_4326.tif

The original raster map is 16,200 x 8,100 pixels. Each map tile image is 256 x 256 pixels. This table shows the number of tiles generated for each zoom level:
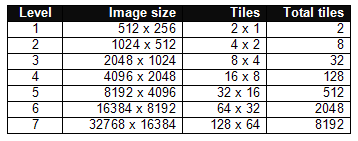
For my purpose, 5 zoom levels are enough. I therefore reduced the map image to 8192 x 4096 pixels:

gdal_translate -outsize 8192 4096 NE2_modis3_4326.tif NE2_modis3_4326_5.tif

Finally, I used GDAL2Tiles to generate the map tiles:

gdal2tiles -title "Natural Earth II" -publishurl http://www.thematicmapping.org/maptiles/ -v NE2_modis3_4326_5.tif naturalearth

See the result as a KML SuperOverlay in Google Earth or in Open Layers. There seems to be a problem that OpenLayers can’t georeference TMS map tiles. It is therefore difficult to combine a map tile layer with other map layers.
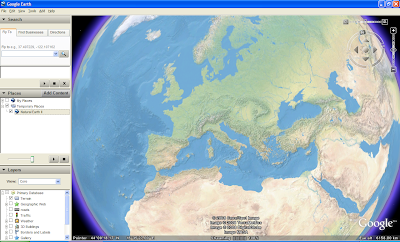

UPDATE 2 APRIL 2008: The OpenLayers example above is now working properly thanks to Christopher Schmidt.

The polygon hole problem in Google Earth

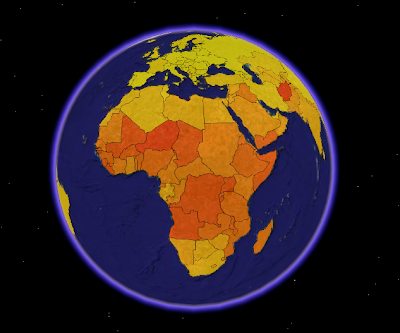
When I’m watching my 3D choropleth maps in Google Earth, strange "holes" appear in polygons representing countries with low values on a statistical indicator (e.g. having a low altitude value). The map below (KML) shows the digital divide in the world (number of Internet users):

The hole in India:


KML has three parameters for controlling the behaviour of polygons; extrude, tessellate and altitudeMode. By setting altitudeMode to clampToGround, my country polygons follow the great circle and get a solid fill. The problem arises when I extrude the polygons by adding an altitude representing a statistical value. Only the vertices of the polygon are extruded to the given altitude, and not the centre of geometry. I miss a clampToAltitude option in KML. A shape should follow earth’s profile, at the requested height above the surface.

There are some workaround to this problem:
  • Give all polygons a minimum altitude to support a "flat roof". Has to be a high value for a country like Russia.
  • Break up large polygons into smaller pieces.
  • Add additional clampToGround polygons to "hide" the holes. Only works with solid fills (no transparency).
Data source for Internet users: UNdata

Thursday 13 March 2008

The first thematic map examples

Now that we have world borders, a spatial database, some PHP code and statistics, - it's time to start the fun stuff: making thematic maps! I've started width choropleth maps (shaded polygons), and the first results can be seen by downloading this KML to Google Earth, or by looking at the images below.

This screenshot from Google Earth is a visualisation of the world fertility (children per woman) 2000-2005. Darker colour means higher fertility. Afghanistan has the highest fertility in the world (7,5 children per woman). The data are unclassified, the countries are coloured according to their fertility value on a colour range.

On this image, the fertility values are also represented by the height of the country polygons. I find it easier to see differences between countries by using this visualisation technique.


View Larger Map

KML is not the optimal format for choropleth mapping in Google Maps. My KML file was too big, so I had to generate a new showing only African countries.

Fertility data are from UNdata. World borders can be downloaded on this site. I can not guarantee that the areas represented by statistical values and the mapped areas are identical, since the data are from two different sources.

UNdata - a free data portal from the United Nations

United Nations has recently launched an internet-based data service for the global user community. There are currently no mapping or charting possibilities, but the data can be generously downloaded and used accoding to the terms:

All data and metadata provided on UNdata’s website are available free of charge and may be copied freely, duplicated and further distributed provided that they are not put up for sale or otherwise commercially exploited and that UNdata is cited as the reference.

Hopefully, national statistical offices will follow in the footsteps of the UN Statisical Division, and free "their" data.

You will soon see examples of thematic world maps based on statistics from UNdata.

WKT to KML transformation

MySQL supports a few functions to convert geometry values between its internal format and either Well-Known Text (WKT) or Well-Known Binary (WKB) representations. An obvious missing feature is the possibility to retrieve data in the widely used GML format. The WKT format is defined in the OpenGIS Simple Features Implementation Specification for SQL and predates GML.

This SQL query retrieves geometry as WKT from a MySQL table:

SELECT iso2, name, AsText(geom) AS wkt FROM borders

I had to store country boundaries as multi-polygons in my database, since many countries consist of several islands. Some of the polygons are complex (i.e. contains holes) because of enclaves. Since the WKT and KML formats are very different, it is not straightforward to do a conversion of complex polygons. This is an example of how a WKT to KML conversion can be done in PHP:


// This function converts a representation of a
// MULTIPOLYGON from WKT to KML
function wkt2kml($wkt){

// Change coordinate format
$wkt = preg_replace("/([0-9\.\-]+) ([0-9\.\-]+),*/", "$1,$2,0 ", $wkt);

$wkt = substr($wkt, 15);
$wkt = substr($wkt, 0, -3);
$polygons = explode(')),((', $wkt);
$kml = '<MultiGeometry>' . PHP_EOL;

foreach ($polygons as $polygon) {
$kml .= '<Polygon>' . PHP_EOL;
$boundary = explode('),(', $polygon);
$kml .= '<outerBoundaryIs>' . PHP_EOL
. '<LinearRing>' . PHP_EOL
. '<coordinates> ' . $boundary[0] . '</coordinates>' . PHP_EOL
. '</LinearRing>' . PHP_EOL
. '</outerBoundaryIs>' . PHP_EOL;

for ($i=1; $i < count($boundary); $i++) {
$kml .= '<innerBoundaryIs>' . PHP_EOL
. '<LinearRing>' . PHP_EOL
. '<coordinates> ' . $boundary[$i] . '</coordinates>' . PHP_EOL
. '</LinearRing>' . PHP_EOL
. '</innerBoundaryIs>' . PHP_EOL;
}
$kml .= '</Polygon>' . PHP_EOL;
}
$kml .= '</MultiGeometry>' . PHP_EOL;
return $kml;
}

Parsing WKB instead of WKT might give a better performance.

Loading spatial data into MySQL

To be able to create choropleth maps in geobrowsers you'll need polygon data for the geographical units you want to map. These polygons can then be coloured according to a statistical value.

If you want to store geographic features in an open source database, you have two options: PostGIS/PostgreSQL or MySQL Spatial. MySQL has limited GIS support compared to PostGIS, but I want to test if it's sufficient for thematic mapping.

I will recommend two software packages: XAMPP and FWTools. XAMPP is an easy to install Apache distribution containing MySQL, PHP and PERL. FWTools is an open source GIS binary containing MapServer, GDAL/OGR, Proj.4, OpenEV, OGDI and Phyton. Maybe more than you need, but it is an easy install. The Swiss Army Knife is the GDAL/OGR library.

I have my boundary polygons stored in a shapefile. There is no MySQL command which enables you to upload spatial data to a database table (this can be done with PostGIS using the shp2pqsql command) . If you have installed the GDAL/OGR library, you can use the ogr2ogr command to upload point, lines or polygons from a shapefile. The command I used was:

ogr2ogr -f MySQL MySQL:my_database,user=root,password=mypassword TM_WORLD_BORDERS_SIMPL-0.1.shp -nln my_table -nlt MULTIPOLYGON -update -overwrite -lco GEOMETRY_NAME=my_polygon_column

World borders for thematic web mapping

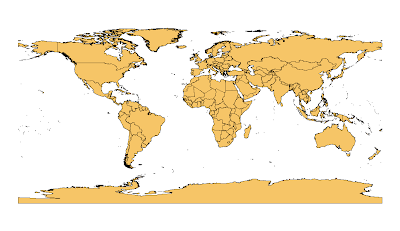
I've spend almost a week tweaking a world borders dataset. Since I need a dataset which I can use without restrictions, I had to dig into the public domain world. I found a proper dataset on the Mapping Hacks website. The original dataset was derived by Schuyler Erle from public domain sources, while Sean Gilles has done some clean up and enhancements.

The main changes I've done are:
  • Polygons representing one country/area are merged into one feature.
  • Added ISO 3611-1 Country codes (alpha-2, alpha-3, numeric-3).
  • Various feature changes to make the dataset more compatible with ISO 3611-1.
  • Added region and sub-region codes from UN Statistical Division.
  • Added longitude/latitude values for each country.

More information on this page and in the "readme.txt" file provided with the dataset. You can download the the dataset in two resolutions. I recommend the simplified version for thematic web mapping.

The dataset could be further optimised by removing small island polygons that are not individual countries.

Download and enjoy!

Sunday 9 March 2008

Using geobrowsers for thematic mapping

The use of geobrowsers (web mapping applications) has increased considerably over the last number of years. Thematic mapping has a long history in geography but the new geobrowsers tend not to focus on this aspect of geographic information representation. On this blog, I want to evaluate the current support and "workarounds" for thematic mapping in selected geobrowsers (OpenLayers, Google Earth and Maps).

This project is initialised by a master's thesis in Geographical Information Science at University of Edinburgh.

Happy for any feedback!