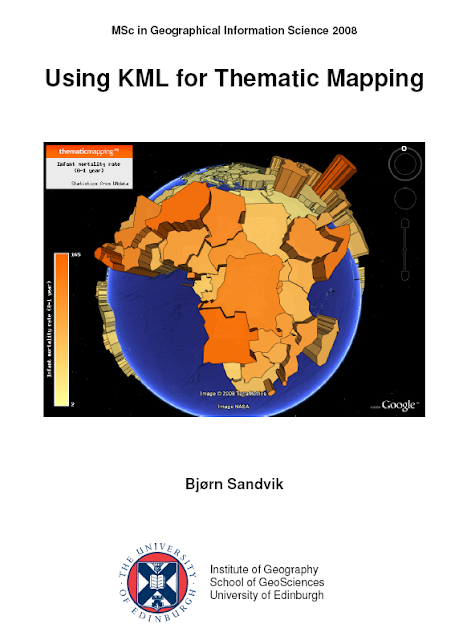
My research paper, Using KML for Thematic Mapping, is now available for download (PDF, 2.3 MB). This is the first part of my MSc GIS thesis from University of Edinburgh. The second part of my thesis, describing the Thematic Mapping Engine, is already available on this page. The thesis was awarded with distinction and an invitation to Googleplex.

This is a short summary:
Why use KML for thematic mapping?
The purpose of this paper is to examine how KML, Keyhole Markup Language, can be used for thematic mapping. A thematic map displays the spatial pattern of a social or physical phenomenon, such as population density, life expectancy or climate change. Thematic mapping has a long history in cartography, but the new geobrowsers tend to have a stronger focus on detailed satellite imagery and general-reference maps than on more abstract data sources.
"From the perspective of the social sciences, the focus on content that is visible from above is problematic, given the abundance of more abstract data sources. A new generation of techniques is needed that can mash such data with the Google Earth base, creating more powerful ways of communicating what social scientists know about the surface of the Earth."

Due to their huge public interest and relative accessibility, geobrowsers are potentially capable of bringing thematic maps or visualizations to a wider audience. By allowing the user to visualise statistical data in an external geobrowser instead of a built-in mapping application, data from various sources can be more readily combined. The value of the statistical data can be increased if the user is allowed to tie it to other data sources. This can be both quantitative and qualitative data, like text, pictures and videos. Furthermore, geobrowsers can also be embedded in other web applications to enhance their utility and general ability to contextualise information.
Why not?
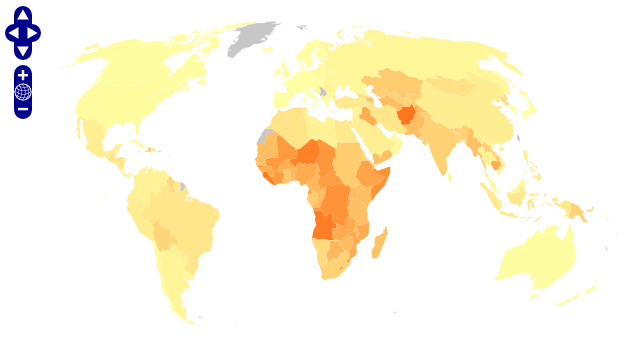
Using geobrowsers for thematic mapping can, however, be problematic. For 2-D geobrowsers, the big players in the web mapping world (Google Maps and Microsoft Live Search Maps) use the Mercator projection. Mercator is a good choice for zoomable satellite imagery, but less suitable for thematic world maps due to the great area distortions. Current 2-D viewers also have problems rendering large vector-based maps, due to web browser limitations.
3-D virtual globes, like Google Earth and Microsoft Virtual Earth, partly avoid the distortions of map projections. Since images still have to be projected onto a flat screen, virtual globes use the Perspective Orthographic projection, which is also the projection inherent in the human visual system (Goodchild, 2008). Unfortunately, the ability to see the whole Earth at once is lost when thematic maps are rendered on a globe. It is also difficult to estimate the area or the volume of proportional symbols when seen in perspective.
How?
Current possibilities for making proportional symbol maps, chart maps, choropleth maps, prism maps and animated maps with KML are presented in the paper. These techniques are described in detail in the supporting document (PDF, 7.4 MB). The paper also compares KML with other stadards of interest; Geography Markup Language (GML), Styled Layer Descriptor (SLD), Symbol Encoding (SE) and Scalable Vector Graphics (SVG).
Conclusion
It is possible, with some inventiveness, to use KML for thematic mapping. There are, at least, three different ways of making proportional symbol maps: by scaling image icons, by calculating the longitude/latitude vertices of regular polygons, or by scaling 3-D Collada objects. Furthermore, an external web service, like Google’s Chart API, can be utilised to create chart maps. Choropleth maps can be generated by using shaded polygons, and turned into prism maps by adding an altitude value to each coordinate tuple. The KML time primitives can be used to create temporal or animated maps. There is also an option to distribute thematic maps as (raster) map tiles, instead of via a vector format.
However, the current KML standard is not optimised for thematic mapping, as it was not explicitly designed for this purpose. Many of the techniques presented in this paper can be characterised as “hacks”, because KML elements are used in ways for which they were probably never originally intended. There are consequently issues that need to be resolved in future KML versions, like the “polygons-hole problem” that occurs when prism maps are rendered on a 3-D globe. There is also a lot of redundancy in the data, as height (altitude) values have to be repeated for each vertex in a polygon, and entire feature structures need to be repeated for every time step in an animation. Proportional symbols would be easier to create if KML supported regular polygons natively. Collada objects would be more suitable for thematic mapping if they were made clickable.
KML needs to be harmonised with other OGC standards to achieve greater interoperability and more extensive use. Particularly important for thematic mapping are styling rules for transforming feature and attribute data into various 2-D and 3-D representations. Such styling rules are already present in the OGC Symbology Encoding specification. KML also needs enhanced graphics functionality and symbolisation constructs. Instead of reinventing the wheel, this functionality could be modelled after the Scalable Vector Graphics (SVG) specification. The KML standard, combined with powerful and accessible geobrowsers, like Google Earth, has a great potential for thematic mapping. Hopefully, this potential will also be realised by the OGC and geobrowser vendors, and lead to future improvements and native support for thematic mapping functionality in the open standards promulgated by OGC and the vendors.
Acknowledgments
I would like to acknowledge and extend my gratitude to the following people who have made the completion of this dissertation possible:
Bruce Gittings and James Reid, for their supervision, advice and constructive criticism.
To those whom I haven’t met, but who have given me valuable feedback and advice on my thematic mapping blog.
And to all the people who believe in open data, open access and open source solutions. This dissertation will be my contribution.
You're welcome to post your feedback in the comments!
