Sunday 30 September 2012

Mapping New Zealand: Exporting tiles from TileMill

I wanted to publish a tiled version of my New Zealand maps. I first tried to upload my maps directly to MapBox.com from TileMill, but their free plan (50 MB upload storage) was not enough for all my zoom levels. This blog post describes an alternative, and a bit more complicated, way to publish your maps from TileMill.

TileMill uses a clever format called MBTiles. This is an open specification from MapBox capabale of storing millions of tiles in a single SQLite database. You can download your maps as MBTiles from the TileMill interface. This was easy to do for my topographic map, and a bit more tricky for my seafloor map which crosses the antimeridian. TileMill don't allow you to select an area for export which crosses the antimeridian, without making a full roundrip around the Earth:


Almost 45,000 tiles are needed to cover this big area for zoom level 0 to 9, while only 4700 tiles are needed to cover the area with data. Although TileMill has support for reduntant tiles, it's not the result I want. So I downloaded the map as two different MBTiles, one for each side of the antimeridian.

There are ways you can serve tiles directly to the web from your MBTiles, but I haven't had time to check how to do this with my shared hosting provider, Bluehost. Instead, I decided to extract all the images from the MBTiles and serve them directly from image folders. You can use MBUtil, also from MapBox, to achieve this:

mb-util nz-seafloor-1.mbtiles tiles/nz-seafloor-1
mb-util nz-seafloor-2.mbtiles tiles/nz-seafloor-2

The tiles are stored in z and x subdirectories such that they have a filesystem path like 0/0/0.png - a format that is supported by most web mapping clients. After the tile export, I just merged the two seafloor folders into one.

To create an interactive map is Leaflet is very easy. Just upload the tile folders to your web server, and write a few lines of JavaScript:

The map looks like this:  


Fullscreen map

The map is centered at the "Geographic Center of New Zealand", which is here in Nelson.

The geographical "centre of New Zealand" allegedly lies on a hilltop near the city centre of Nelson.


We're heading off for the Abel Tasman Coast Track tomorrow, and there won't be any blog updates the next week :-)

Friday 28 September 2012

Mapping New Zealand: Doing magic with TileMill

Finally, I got some time to play with TileMill. I've added some textures to my shaded relief map, and I'm quite happy with the result. Here are a few samples:

Tongariro National Park

Marlborough Sounds

Westland National Park

Milford Sound

All the data I've added are from NZ Topo 500 from LINZ Data Service, and I've tried to find natural looking colors for my map stylesheet:


Creating a shaded relief map of New Zealand

After creating a shaded relief map of New Zealand's seafloor, and it's time to move onshore. I'm going to use the same slope-enhanced hillshade technique. It was a bit tricky, but I think I've found a workflow that works.


While we got a 250 meter resolution Digital Elevation Model (DEM) of New Zealand's seafloor, you can download a 25 meter resolution DEM for the North and South Island from Landcare Research. The free datasets are available from the LRIS portal, where you can also read about the accuracy of the data. I got an invitation to visit Landcare Research when I was passing through Palmerston North. They do a lot of open source stuff, and they have some exciting projects going on!

Also, if you have a budget, you should definately consider buying the 8 meter resolution DEM from the best cartographers (or mapsmiths which they like to call themselves) in New Zealand - Geographix. They also provide some free samples for you to play with. You will be amazed by the level of detail in their well-crafted maps! They were kindly offering me an office space while I was visiting Wellington, and it was great to be part of such an inspiring environment - and what a view they have from their office on the edge of the Botanic Garden:

Wellington seen from the Geographx office and studio in the old Dominion Observatory.

Let's move on with our elevation model from Landcare Research. I first tried to merge the two DEMs for the North and South Island, but I ran into memory problems at a later stage because of the high resoltion. The commands below are covering the North Island, but the same set of techniques applies to the South Island DEM. I downloaded the GeoTIFF version of the datasets.

The datasets are in the New Zealand Transverse Mercator 2000 (NZTM2000) projection. As this projection is not supported by the map studio I want to use, TileMill, we need to reproject it into Web Mercator using gdalwarp:

gdalwarp -t_srs EPSG:3785 -tr 76.4370282745361 76.4370282745361 -r bilinear lris-nzdem-north-island-25-metre-GTiff/1-0001-0001.tif nz-dem-north-11.tif

At the same time I'm downscaling (-tr) the dataset so it has the same resolution as zoom level 11 in the widely used Web Mercator tiling scheme. Where do I get this 76.4370282745361 number come from?


So to cover the world at zoom level 11 you need almost 4.2 million tiles, and it becomes 4 times more for every zoom level you add to the party. Luckily we're only mapping a small part of the world, New Zealand. Web Mercator consider the world to be a square, 40,075,016.68 meters wide and tall (the length of the Equator). With a tile size of 256 pixels you get the a maximum resolution of 40,075,016.68 / 256 =  156,543.03390625. You get the map scale by dividing the resolution by 0.00028 (pixel size). The rest is simple math. The scale is only correct at the Equator. For 41° south latitude, running through the Cook Strait between the North and South Island, the map scale for zoom level 11 should be around 1:360,000 if my calculations are right (multiply by 1.325). Read more about the map projection and tiling scheme here.

Let's create a color relief from the DEM. I've created a typical color scheme which progresses from greens for lower elevations up through yellows/browns, and on to grays and white at the highest elevations:

gdaldem color-relief -co compress=lzw nz-dem-north-11.tif color-relief.txt nz-dem-north-11-relief.tif


Next, I want to get rid of the green ocean by only keeping the areas within the dataset I created in my last blog post (I've splitted the shapefile in two, one for each island):

gdalwarp -co compress=lzw -dstalpha -cutline shape/nz-north-webmerc.shp nz-dem-north-11-relief.tif nz-dem-north-11-relief-cut.tif


To create a nice looking hillshade, I'm going to apply the same technique as I did for the seafloor map (where you get all the details). First we create a "normal" hillshade:

gdaldem hillshade -alt 60 nz-dem-north-11.tif nz-dem-north-11-hillshade.tif


Then we create a slopeshade:


gdaldem slope -co compress=lzw nz-dem-north-11.tif nz-dem-north-11-slope.tif

gdaldem color-relief -co compress=lzw nz-dem-north-11-slope.tif slope-ramp.txt nz-dem-north-11-slopeshade.tif


Then we use Mapnik XML to combine the hill- and slopeshading:

nik2img.py nz-dem-north-hillslopeshade.xml nz-dem-north-11-hillslopeshade.tif -d 10497 14188

(for the South Island DEM the dimension -d is: 12637 14895)

We also to some cutting to get rid of the ocean:

gdalwarp -co compress=lzw -cutline shape/nz-north-webmerc.shp nz-dem-north-11-hillslopeshade.tif nz-dem-north-11-hillslopeshade-cut.tif


We can combine the color relief and the enhanced hillshade in TileMill (I'm keeping them separate so we can apply the hillshade to different textures):


We can also add New Zealand's seafloor to the map:


Wednesday 26 September 2012

Mapping New Zealand: Editing and merging shapefiles with QGIS

The data you want to map is not always in the format you need. I was looking for a dataset containing polygons for all land areas (islands) in New Zealand (1:500,000 scale), but I couldn’t find it on the LINZ Data Portal. So I tried to create it myself from the data I found:

Update Oct. 8th 2012: LINZ has added new polygon datasets for all land areas in New Zealand (see comments below), so you don't have to do the job described in this blog post. The techniques for editing and merging shapefiles are still valid.

NZ coastlines (Topo, 1:500k)
This dataset (nz-coastlines-topo-1500k.shp) contains coastlines for North Island, South Island and Stewart Island, - but not for offshore islands (most notably the Chatham Islands) and the smaller islands around the coast. The coastlines are represented as lines, while I need the data as island polygons. This is how I converted the lines into polygons with QGIS:

Vector -> Geometry Tools -> Lines to polygons


I named the new dataset "nz-main-island-polygons.shp".

(I wasn't able to do the same with the 1:250,000 version of the coastlines dataset, as the coastlines are divided into multiple line segments that didn’t merge in the correct order. Please let me know if anyone are able to convert this dataset into polygons! At 1:50,000 scale, LINZ is providing a dataset containing polygons for all islands.)

I’ve not found data for the offshore islands at 1:500,000 scale, but the smaller islands around the coast are available:

NZ island polygons (Topo, 1:500k)
This dataset (nz-island-polygons-topo-1.shp) also contains inland islands (islands in lakes), which I don’t want. I made a copy of this dataset named "nz-coast-island-polygons.shp" and removed the inland islands manually with "Select features by freehand" in QGIS.


I now want to merge the two shapefiles into one. This can easily be achieved in QGIS:

Vector -> Data Management Tools -> Merge shapefiles to one


We now got a polygon shapefile (nz-land-polygons.shp) containing all land areas of New Zealand, except the missing offshore islands.


Lastly, I also need this dataset in the Web Mercator projection (for my next blog post). I’m using ogr2ogr:

ogr2ogr -s_srs EPSG:2193 -t_srs EPSG:3785 nz-land-polygons-webmerc.shp nz-land-polygons.shp

(Written on a rainy day at the Hopewell lodge in Marlborough Sounds. A higly recommended place to releax a few days!)


Mapping New Zealand: Dealing with the antimeridian in TileMill

I want to play with my new seafloor map in TileMill, which is a great map design studio. It’s built on top of Mapnik, but instead of XML you can style your maps with CartoCSS, which is much more user friendly. The biggest limitation of TileMill is that it only supports the Web Mercator projection (even though the underlying rendering engine, Mapnik, handles multiple map projections very well). Hopefully, TileMill will add support for other map projections and custom tiling schemes in the future.

Web Mercator is clearly not the ideal map projection to use for countries far north, like Norway (use UTM 33N), or countries not so far south, like New Zealand (use NZTM2000). Another problem with Web Mercator, and other projections centered at the prime meridian, is that you often get troubles crossing the antimeridian on the opposite side. This is unfortunate for New Zealand, where the animeridian is just east of the North Island, leaving the Chatham Islands on the other side. When I tried to reproject my seafloor map into Web Mercator, I got a dataset that made a roundtrip around the Earth. This blog post tells you how to avoid this trip by dividing the source dataset into two parts.

Gisborne, in northeastern New Zealand, proudly claims to be the first city in the world to greet the sun each day.

You’ll see that this seafloor map is different from the one I created earlier, as I’ve masked out the islands with a white color. I did this with Mapnik XML using this LINZ dataset. I want to add land data as separate layers in TileMill.

The seafloor map of New Zealand is 12,000 x 15,200 pixels and it crosses the antimeridian (180° longitude). This is not a problem with the original map projection, as it’s centered at 100° east longitude, and not the prime meridian (0° longitude). What happens if we reproject the dataset into Web Mercator

gdalwarp -s_srs "+proj=merc +lon_0=100 +lat_ts=-41 +x_0=0 +y_0=0 +datum=WGS84 +units=m +no_defs" -t_srs EPSG:3785 -co compress=lzw -r bilinear nz-seafloor.tif nz-seafloor-webmerc.tif

(To use Mercator 41 with gdalwarp you need to specify the full Proj4-definition.)

The result is a very wide image spanning  the globe (and I’m not able to get the same resolution as the original image):


Instead of this wide image, I decided to split the image in two at the antimeridian with gdal_translate:

gdal_translate -srcwin 0 0 7723 15200 -co compress=lzw nz-seafloor.tif nz-seafloor-1.tif

gdal_translate -srcwin 7724 0 4276 15200 -co compress=lzw nz-seafloor.tif nz-seafloor-2.tif


This will create two new map images, one on each side of the antimeridian. There is one column of pixels, which was unfortunate enough to cross the antimerdian, that is now missing.

Next, I’m reprojecting both images into Web Mercator using gdalwarp:

gdalwarp -s_srs "+proj=merc +lon_0=100 +lat_ts=-41 +x_0=0 +y_0=0 +datum=WGS84 +units=m +no_defs" -t_srs EPSG:3785 -co compress=lzw -r bilinear nz-seafloor-1.tif nz-seafloor-1-webmerc.tif

gdalwarp -s_srs "+proj=merc +lon_0=100 +lat_ts=-41 +x_0=0 +y_0=0 +datum=WGS84 +units=m +no_defs" -t_srs EPSG:3785 -co compress=lzw -r bilinear nz-seafloor-2.tif nz-seafloor-2-webmerc.tif

Because of the missing pixel, the images don’t overlap entirely at the antimeridian. I’m therefore stretching the images a tiny bit (which is not recognizable at this scale) to make it seamless:

gdal_translate -a_ullr 17482842.051 -7842209.647 20037508.34 -2796127.081 -co compress=lzw nz-seafloor-1-webmerc.tif nz-seafloor-1-webmerc-fix.tif

gdal_translate -a_ullr -20037508.34 -7842313.166 -18622711.547 -2796127.081 -co compress=lzw nz-seafloor-2-webmerc.tif nz-seafloor-2-webmerc-fix.tif

We now have to map images that we can load into TileMill, which will stitch them together again.


Saturday 22 September 2012

Creating a custom map tiling scheme for New Zealand’s seafloor

First of all I want to thank Brent Wood at National Insitute of Water & Atmospheric Research (NIWA) for inviting me to their office after writing my first blog post about seafloor mapping in New Zealand. Luckily I happened to be in Wellington where they are located, the best city in New Zealand (see photos below)! I was also fortunate to meet Kevin Mackay, the Marine Database Manager who’s responsible for the bathymetry dataset I’ve been using to create this map. You’ll be surprised about the amount of work and data needed to create a bathymetry dataset for such a large and hidden area of our planet. This mapping has been beneficial to New Zealand, as they have been able to claim rights to 1.7 million square kilometers of extended continental seabed, an area about six times New Zealand’s total land area.

In the last blog post we created a seafloor map of New Zealand using shading relief. The map image we created was very large, 12000 x 15200 pixels, with a resolution of 250 meters per pixel. To create an interactive web map we need to cut the image into tiles for a number of zoom levels.  As I’m using a custom map projection (Mercator 41), I also have to define a custom tiling scheme. This is my suggestion:


The red area shows the extent of the dataset. The yellow squares show the tiles for zoom level 0 to 2. The biggest square covers an area of 4,096,000 x 4,096,000 meters.  Data nerds will know that this number is easily divided by 256, the de facto size of map tiles in pixels. The tile area is defined by these bounds (left, bottom, right, top): 4200000, -6096000, 8296000, -2000000. This table shows the resolution and scale for all zoom levels: 


Zoom level 6 is maching the resolution of our dataset, 250 meters per pixel. We now have the information we need to define the tiling scheme in TileCache:

[nz-seafloor]
type=Mapnik
src=EPSG:3994
bbox=4200000,-6096000,8296000,-2000000
maxResolution=16000
mapfile=/home/turban/NZ/Bathymetry/nz-seafloor.xml

I’m not going into detail here, read more about how you can define custom tiling schemes with TileCache, Mapnik and Leaflet in this blog post. I’m using tilecache_seed.py to render the map tiles: 

tilecache_seed.py -f nz-seafloor 0 7

Next, we can use Leaflet to load the tiles into an interactive map:


This is what the map looks like:


Show fullscreen

----

A few photos from the best captial city in the world, Wellington:


Thursday 20 September 2012

Creating a seafloor map using shaded relief

I'll use the bathymetry data from NIWA to create a seafloor map of New Zealand using shaded relief techniques. I used the same techniques when I created the terrain map of Jotunheimen in Norway, so I won't go into detail here.

Let’s start by creating a color relief of the seafloor. I’ve used a blue color gradient similar to the one used by NIWA, progressing from light shallows to dark depths.

Source: NIWA

gdaldem color-relief -co compress=lzw nz-bathymetry.tif depth-gradient.txt nz-bathymetry-relief.tif


I want to enhance the view by using a couple of hillshade techniques. Let’s create a plain hillshade with gdaldem:

gdaldem hillshade -alt 60 -az 135 -co compress=lzw nz-bathymetry.tif nz-bathymetry-hillshade.tif 

Notice that the light source (-az) is not from the default top left position (azimuth = 315°), but in a bottom right position (azimuth = 135°). The reason for this is that bathymetry data are inverted compared to elevation data, with higher depths having higher values.  


The problem with this hillshade is that it’s all grey, and this grey color will blend with our color relief.
To enhance the hillshade we can apply another technique. This technique is described in the document “Creating Slope-Enhanced Shaded-Relief Using Global Mapper” by Kent D. Brown at Utah Geological Survey. The technique clears out the gray from low-angle slopes so the map colors are not "muddied" by shading. The document describes how to do this in Global Mapper, but we’ll try to do the same the hard way with GDAL and Mapnik.

As described in my previous blog post, creating slope shading is a two-step process. First we need to create a raster from the bathymetry data where each pixel contains an angle, varying from 0 to 90 degrees as the seafloor ranges from horizontal to vertical:

gdaldem slope -co compress=lzw nz-bathymetry.tif nz-bathymetry-slope.tif  

Secondly, we use this raster to slope shading by assigning a color to each pixel, using the same technique as for color relief. What we’ll do is to turn all slopes of 0° white, and any slope above 5° black. Anything in between will be in various shades of gray. Adding these two lines to the configuration file will do the trick:

We can then create slope shading with this command:

gdaldem color-relief -co compress=lzw nz-bathymetry-slope.tif slope-ramp.txt nz-bathymetry-slopeshade.tif 


Next we can use Mapnik to combine the hill- and slope shade:

nik2img.py nz-bathymetry-hillslopeshade.xml nz-bathymetry-hillslopeshade.tif -d 12000 15200 


Lastly, we can combine this enhanced hillshade with the color relief, together with a few datasets from LINZ Data Service:


nik2img.py nz-seafloor.xml nz-seafloor.tif -d 12000 15200 --projected-extent 4800000 -5900000 7800000 -2100000


In my next blog post, I'll turn this image into an interactive web map. 

Wednesday 19 September 2012

Creating a Seafloor Map of New Zealand

New Zealand is the perfect country to map, not only because of all the free data available - it also has a very interesting topography, above and below the sea surface. Actually, around 95 percent of New Zealand’s territory is under water. So I wanted to start off my mapping tour by creating a seafloor map of New Zealand.

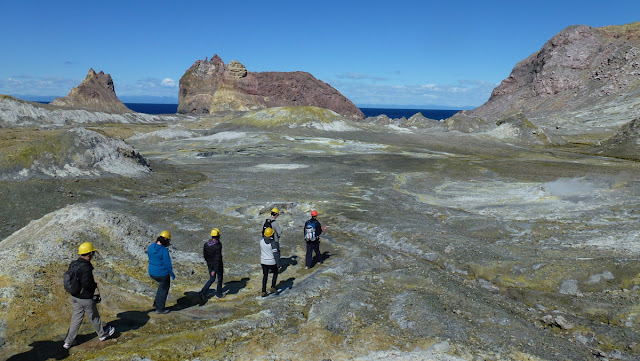
On my way to Whakaari / White Island, New Zealand’s only active marine volcano. Why is it there and what's hiding below the surface?

You can get bathymetry data (underwater depth) from the National Institute of Water and Atmospheric Research (NIWA). The dataset covers New Zealand's Exclusive Economic Zone and is free to use for non-commercial purposes (terms and conditions). This page describes how the data was collected. I downloaded the “NZ 250m ESRI ASCII grid 530Mb” version of the dataset.

The zip containes two files, RegionalBathymetry2008.asc and RegionalBathymetry2008.prj. The first file contains the actual data in an ASCII grid format. The last file contains information about the projection used, and if you open this file in a text editor it will show you this information:

Projection    MERCATOR
Datum         WGS84
Spheroid      WGS84
Units         METERS
Zunits        NO
Xshift        0.0
Yshift        0.0
Parameters    
 100  0  0.0 /* longitude of central meridian
 -41  0  0.0 /* latitude of true scale
0.0 /* false easting (meters)
0.0 /* false northing (meters)

What does it tell us?
  • The dataset is in a Mercator projection. This is clearly not the best map projection to use for New Zealand, but the "official" projection, New Zealand Transverse Mercator 2000 (NZTM2000), is only applicable for the main New Zealand island group. 
  • It’s using the WGS84 spheroid.
  • The coordinate unit is meters.
  • The central meridian is not the prime meridian (0° longitude), but 100° east longitude. This is useful, as we avoid problems with the antimeridian (180° longitude), which is passing through the area. I’ll explain these problems in a later blog post.
  • The scale of a map using this projection will only be true at 41° south latitude, running through the Cook Strait between the North and South Islands.
The code for this projection in ESPG:3994 and the Proj4 definition (we'll use this one later) is "+proj=merc +lon_0=100 +lat_ts=-41 +x_0=0 +y_0=0 +datum=WGS84 +units=m +no_defs".

You can use the gdalinfo command to obtain more information about the dataset:

gdalinfo -mm RegionalBathymetry2008.asc

Driver: AAIGrid/Arc/Info ASCII Grid
Files: RegionalBathymetry2008.asc
       RegionalBathymetry2008.prj
Size is 12115, 15391
Coordinate System is:
PROJCS["unnamed",
    GEOGCS["WGS 84",
        DATUM["WGS_1984",
            SPHEROID["WGS 84",6378137,298.257223563,
                AUTHORITY["EPSG","7030"]],
            TOWGS84[0,0,0,0,0,0,0],
            AUTHORITY["EPSG","6326"]],
        PRIMEM["Greenwich",0,
            AUTHORITY["EPSG","8901"]],
        UNIT["degree",0.0174532925199433,
            AUTHORITY["EPSG","9108"]],
        AUTHORITY["EPSG","4326"]],
    PROJECTION["Mercator_1SP"],
    PARAMETER["latitude_of_origin",100],
    PARAMETER["central_meridian",0],
    PARAMETER["scale_factor",1],
    PARAMETER["false_easting",-41],
    PARAMETER["false_northing",0],
    UNIT["METERS",1]]
Origin = (4795705.551502100200000,-2067845.457881099500000)
Pixel Size = (250.000000000000000,-250.000000000000000)
Corner Coordinates:
Upper Left  ( 4795705.552,-2067845.458)
Lower Left  ( 4795705.552,-5915595.458)
Upper Right ( 7824455.552,-2067845.458)
Lower Right ( 7824455.552,-5915595.458)
Center      ( 6310080.552,-3991720.458)
Band 1 Block=12115x1 Type=Float32, ColorInterp=Undefined
    Computed Min/Max=-3367.677,10069.260
  NoData Value=-9999

In addition to the projection facts, what does it tell us?
  • The image or grid size is 12,115 x 15,391 pixels or cells.
  • Each pixel or grid cell covers an area of 250 x 250 meters.
  • The extent of the area is defined by four coordinate pairs. The size of the area is 3,028,750 x 3,847,750 meters.
  • The image is single band and the debth data is stored as 32-bit floating-point numbers. The maximum depth is 10,669 meters. Interestingly, the minimum depth is -3,368 meters. This tells us that the dataset also contains onshore elevation data, and the lowest number is actually 3.368 meters above sea level. I’m not sure why this is almost 400 meters below the Mount Cook, the highest mountain in New Zealand (3,754 m).
Let’s add the information we’ve got on Google Earth:


The red area shows the extent of the dataset. The yellow lines show the equator and the central meridian (100° east longitude). The pin is located at the origin of the coordinate reference system (0, 0). The black line is at 41° south latitude, where we have true scale (250 meters per pixel).  The resolution will be higher further south, and lower as we move north.

To make the calculations easier to follow, I’m going to crop the dataset a bit with gdal_translate:

gdal_translate -projwin 4800000 -2100000 7800000 -5900000 -a_ullr 4800000 -2100000 7800000 -5900000 -co compress=lzw RegionalBathymetry2008.asc nz-bathymetry.tif

This command will create a dataset that has a size of 12,000 x 15,000 pixels within an area of 3,000,000 x 3,800,000 meters (3,000 x 3,800 km). The resolution is still 250 meters per pixel.

In the nextblog post we’ll start playing with the data.

---- 

A few more photos from White Island:


Towards the crater.


Between July and August 2012 White Island showed signs of increased activity with lake and gas levels rising from inside the crater. On 5 August 2012 a minor eruption occurred, rising the alert level to 2 of 5.

The main crater. Where's gollum?!?

Walking on the moon. Virtually no vegetation survives the harsh acidic environment.

Numerous failed attempts were made to mine sulphur from White Island. Before the days of antibiotics, sulphur was used in medicines as an antibacterial agent, in the making of match heads, and for sterilising wine corks.

Tuesday 11 September 2012

Getting free data in New Zealand

So far on my travels through New Zealand I’ve been a bit frustrated with the the slow and costly WiFi services. Access to publicly funded data about the country is a totally different story. It’s fast, easy, and free! Countries who lock up their publicly funded data (including my own country, Norway) should definitely look to New Zealand.

So where can you get free data about New Zealand? As I’ve just been in the country for two weeks, I’m not the best person to answer this question. But I’ve done some research and the natives where happy to tell me when I asked this question on my blog a few weeks ago.

Koordinates
This great Auckland-based company has created a portal which allows you to search, sort, bookmark and share geographic data sets. Download in the the format, projection and area you need, connect with web services using industry standard services or developer friendly APIs, or explore data within the browser. It’s a success story in how geodata should be distributed.

LINZ Data Service
Land Information New Zealand (LINZ) is the national provider and administrator of a wide range of geographical information. Here you can download hydrographic and topographic data (up to 1:50,000 scale), in the same easy to use Koordinates-fueled interface.

LRIS Portal
The Land Resource Information Systems (LRIS) Portal is hosted by Landcare Research, an Environmental research organisation specialising in sustainable management of land resources. Here you can find a 25 meter Digital Elevation Model (DEM) of the North and South Island, - and a lot of data about the environment in New Zealand. Some of the data from Lancare Research is also available as a web service (WMS, WMS-C).

The National Land Resource Centre (NLRC)
A science center coordinated by Landcare Research in collaboration with other science organisations, government and businesses. They’ve created an extensive list of datasets provided by different organisations related to land resources.

geodata.govt.nz
A catalogue of publicly-funded geospatial data, and part of New Zealand's developing national spatial data infrastructure (NSDI).

data.govt.nz
A directory of publicly-available, non-personal New Zealand government held datasets. This site does not host data, instead it links to datasets held on other government websites.

DigitalNZ
An inititative led by the National Library of New Zealand helping people to use digital material from libraries, museums, government departments, publicly funded organisations, the private sector, and community groups.

Other resources:

Have I missed something? Please add a comment below and I’ll try to keep this post updated.

---

A few photos from my travels:

At the Tongariro Alpine Crossing together with a group from the great Mountain Cartography Workshop.

The Tongario Alpine Crossing, rated as the best on-day trek available in New Zealand. Part of the track is still closed after the recent eruption at Mount Tongariro.

Mount Ngauruhoe or Mount Doom in Lord of the Rings:

Geothermal activity at Whakarewarewa.

Boiling mud pool created by acid gases and steam that cause the decomposition of minerals to form a clay. The temperature is about 90-95°C.

Pohutu geyser erups once ore twice per hour and can reach heights of up to 30 meters.

(Written at The Bean Café and Roastery in Whakatane, who has the best WiFi offer in New Zealand!)