Monday 27 September 2010

Farewell to Globalis and UNA Norway

After almost 9 years at the United Nations Association of Norway (UNA Norway), it was time to seek new challenges. On monday I'll start working for the Norwegian Broadcasting Corporation (NRK). I'll miss my great colleagues and UNA-Norway - and my baby, Globalis.


Globalis is now 7 years old. She speaks 5 languages fluently; Norwegian, Swedish, Danish, Finnish and Icelandic. She is very busy teaching thousands of visitors every day about our diverse, unfair and exciting world - by visual means:


Globalis, a lot of clever people have taken part in your upbringing, and I'm sure UNA Norway will give you a long and prosperous life. You're mission in life couldn't be more important!

Please follow Globalis on Facebook!

-----

A vital part of Globalis is the world map collection. So far it contains 40 maps on environment and human impact. The map data was researched, collected and prepared in cooperation with Nordpil and Grid-Arendal


Saturday 28 August 2010

Mapping with Google Fusion Tables

My workplace, United Nations Association of Norway (UNA Norway), has 700 member schools across the country. We wanted to include a map on our webpage to show all our members. The map should be automatically updated when new schools are added or removed. From previous experience, I knew that having 700 markers on a single map is problematic. Google Fusion Tables overcomes this limitation in a clever way.

Especially for nerds: We use SugarCRM to keep track of our members. SugarCRM is highly customisable and it's easy to add extra fields for latitude and longitude positions. I wrote a PHP script which synchronises a SugarCRM database (MySQL) with Google Fusion Tables. The script first checks if the last modifed date or the number of rows are equal. If not, the script loops through all rows (members) in the SugarCRM database. If the member exist in Fusion Tables, it's updated if modified date is different. If the member don't exist in Fusion Tables, it's inserted. Fusion Tables members that don't exist in SugarCRM database are deleted. This script helped me to get started.

When the data are available in Google Fusion Tables, it's easy to create an embeddable map:


Full screen view

Google Fusion Tables avoids the browser limitation of showing maximum 200 markers by generating transparent PNG tiles instead of indvidual markers. This url shows you a PNG image of our member schools around Oslo:

Friday 4 June 2010

The love/hate relationship with GIS (Part 3)


New uses of GIS
There have been a growing number of attempts to combine critical human geography with GIS methods and techniques (O'Sullivan, 2006). Here are some successful examples where researchers informed by social theory have engaged with the technology, rather than to criticise from the outside.

People Participating GIS (PPGIS) emerged out of the critic that GIS further privileged those in power and marginalised others. PPGIS pertains to use GIS to broaden public involvement in policymaking and to promote the goals of non-governmental organisations (NGOs), grassroot groups, and community-based organisations (Sieber, 2006). But it is important to be aware that PPGIS can introduce new set of power relations into a community (Crampton, 2003)

Counter-mapping is a related concept to PPGIS, referring to efforts to contest and undermine power relations and asymmetries in relation to cartographic products (Harris and Hazen, 2006). The term was introduced by Nancy Peluso (1995) describing the commissioning of maps by forest users in Indonesia as a way of contesting state maps of forest areas that had long undermined their interest in those resources.

Jeremy Crampton (2001) says that GIS technology enables us to create exploratory mapping environments in which knowledge can be constructed. This is challenging the prevailing picture of cartography as the communication of information form the cartographer to the map reader. Since maps are part of a general discourse of power, mapping should proceed through multiple, competing visualisation which are made on the spot by the user. Exploratory mapping environments are noe now easier to create with recent advances in web technologies and standards. This enables us to embed information from various sources and in various forms (maps, images, video, sound and text). The user can to a large extent determine what information is to be displayed and in what context. It is important to mention the digital divide, as exploratory mapping is only effective when people have access to the technology and knowledge to use it (Crampton and Krygier, 2005).

Combining the best of both worlds
The love/hate dichotomy with GIS seems to be related to the opposition between quantitative and qualitative research. Pavlovskaya (2006) sees this as en extension of different epistemologies and not because these methods are incompatible. For the supportes and critics alike, GIS had been firmly rooted in the quantitative camp. Pavlovskaya finds this misleading, as GIS is neither stictly quantitative nor qualitative but may be used in different types of research. Geographic databases have the capability of storing more than numerical information, and there are examples where qualitative researchers have worked with unconvential GIS data sources. As mentioned above, narratives, hand-drawn maps, graphics, photos and videos can also be stored in these databases. Feminist geographers have begun to model individual experience as emotions or webs of daily economic practices (Pavlovskaya, 2006).

Geographers have also revisited the usefulness of quantitative methods as they no longer cling to the idea that quantitative methods allow objective research, recognising that knowledge is situated (Marshall, 2006). I tend to agree with Openshaw that "the modern geographer should be a pragmatist and seek to use any and all available methods, mixing and matching different tools and philosophies, as when and were appropriate" (Openshaw, 1992). Dobson (2002) belives that "a century from now, science historians will look back and decide GIS was a major revolutionary force in science and society, not because we made better maps, but because we forced disciplines to talk to one another." Future will tell if GIS becomes the glue between quantitative and qualitative research.


References
  • Crampton, J., 2001, "Maps as social constructions: power, communication and visualization", Progress in Human Geography, 25(2), pp. 235-253
  • Crampton, J., 2003, "How can Critical GIS be defined?", GeoWorld, 16. p. 54
  • Crampton, J., Krygier, J., 2006 "An Introduction to Critical Cartography", ACME: An International E-Journal for Critical Geographies, 4(1), pp. 22-23
  • Dobson, J., 2002, "What's new about GIS?" GeoWorld, 15(3), pp. 22-23
  • Harris, L., Hazen, H., 2006, "Power of Maps: (Counter) Mapping for Conservation", ACME: An International E-Journal for Critical Geographies, 4(1), pp. 99-130
  • Marshall, A. 2006, "A critique of the development of quantitative methodologies in human geography", Radical Statistics, 92.
  • O'Sullivan, D., 2006, "Geographical information science: critical GIS", Progress in Human Geography, 30(6), pp. 783-791.
  • Openshaw, S., 1992, "Further thoughts on geography and GIS: a reply", Environment and Planning A, 24, pp. 463-466
  • Pavlovskaya, M., 2006 "Theorizing with GIS: a tool for critical geographies?", Environment and Planning A, 33, pp. 2003-2020
  • Peluso, 1995, N., 1995 "Whose woods are these? Counter-mapping forest territories in Kalimantan, Indonesia", Antopode, 27(4), pp- 383-406
  • Sieber, R., 2006, "Public Participation Geographic Information Systems: A Literature Review and Framework", Annals of the Association of American Geographers, 93(3), pp. 491-507

The love/hate relationship with GIS (Part 2)


Military connections
"The war against Iraq in 1990-91 was the first full-scale GIS war". This is the opening line in a paper by Neil Smith (1992) in the Progress in Human Geography journal. Smith describes the military roots of GIS and how the techology is (mis)used in modern warfare. Technology does not cause war, but Smith argues that techniques are not easily separatable from their uses. GIS are making war more "doable". These connections were clearly visible in the air and land operations, Operation Desert Storm, of the first Gulf War. Digitised map data was provided by military and scientific agencies. 3D simulations were used to navigate through the desert, and "Geo-smart" bombs were equipped with a video camera so their way to the target could be screened by CNN. Smith calls this a "perverse extravaganza" as the war claimed an estimated 200 000 Iraqi lives. Smith is conserned how GIS, combined with modern weapon systems, enables us to forget the actual effects of war by substituting a slick virtual reality (Crampton, 2004). The military connections of GIS have become stronger since Smith's paper was published (Goodhild, 2006), but the virtual reality version is "harder to sell" when Al Jazeera is showing the real effects on the ground.


Crampton (2004) makes a point that we now live through the second GIS war, but it is occuring in a very different way: through "war on terrorism" and "security". He is concerned about the freedoms we are in danger of giving up in the name of security, and how the GIS industry is becoming a "research arm of the security industry". This leads us to another big critique of GIS; its potential use for electronic surveillance.
 
Privacy, surveillance and geoslavery
The introduction of GIS has raised consern about information privacy, primarly due to its capacity of integrating spatial information and personal information from different sources (Dobson and Fisher, 2003). The technical practise of geodemographics has been especially criticised (Goss, 1995; O'Sullivan, 2006). Geodemographics is an information technology that enables marketers to predict behavioural response of consumers based on statistical models of identity and residential location (Goss, 1995). Its main use is to find new markets for products and services by precisely locating potential customers. A geodemographic system combines GIS with electronic databases composed of records of consumer indentity and behaviour. Goss (1995) criticies this practise as it's based upon a rationality that desires to bring the processes of consumption under the control of the production regime. He is also concerned about how geodeomographics displays a strategic intent to control social life, and how the segmentation schemes imply social judgement.

Dobson and Fisher (2003) have gone even further by introducing the term geoslavery for a potential threat in the near future. Geoslavery is defined as "the practise in which one entity, the master, coercively or surreptitiously monitors and exerts control of another individual or slave (Dobson and Fisher, 2003:47). Today, these human tracking systems are combining GPS receivers, mobile phones, radio transmitters and GIS technology to support Location Based Services (LBS). It is stated, in a quite paranoic way, that the "countles benefits of LBS are countered by social hazards unparalleled in human history". I presume theay want to provoke since their pricipal objectives in to forewarn the public, foster debate and propose remedies where there is lack of legislation.


References

  • Crampton, J. 2004, "Rethinking GIS and [homeland] security", GeoWorld, 19(3), p. 22.
  • Dobson, J., Fisher, P., 2003, "Geoslavery", IEEE Technology and Society Magazine, spring 2003, pp. 47-52.
  • Goodchild, M., 2006, "GIScience Ten Years After Ground Truth", Transactions in GIS, 10(5), pp. 687-692.
  • Goss, J., 1995, "We Know Wo You Are and We Know Where You Live: The Instrumental Rationality of Geodemographic Systems", Economic Geography, 71(2), pp. 171-198.
  • O'Sullivan, D., 2006, "Geographical information science: critical GIS", Progress in Human Geography, 30(6), pp. 783-791.
  • Smith, N., 1992, "History and philosophy of geography: real wars, theory wars", Progress in Human Geography, 16(2), pp- 257-2718.

Thursday 3 June 2010

The love/hate relationship with GIS (Part 1)


Geographical Information Systems (GIS) did not ease into the geography departments without friction, and it is has been said that "academic geographers often have a love/hate relationship with GIS" (Schuurman, 2004:2). In this blog series, I try to reveal this dichotomy by looking at the historical background and the arguments put forward. As the love/hate relationship weakened in the second half of the 90s, we see how co-operation between GIS scholars and their critics fostered a new GIS discourse. The series ends by looking at further possibilities of combining quantitative and qualitative methods with GIS.


Geographical information systems (GIS) influence many aspects of the modern society. We leave locational, electronical tracks whenever we use a credit card, turn on our mobile phone or send an email. Car navigation systems are becoming state-of-the-art in new automobiles. Web mapping tools like Google Earth are bringing the ideas of GIS to a wide audience. Many countries and organisations are working on their spatial data infrastructures. GIS was not something that developed within the geography departments, and the advancement of tools and techniques are to a large extent done by actors outside academia.

Science wars in geography
"It's funny how old (and tiresome?) debates in geography never die, they just find new battlefields" (Walton 1995:6)
The love/hate relationship with GIS can be traced back to the criticism of the quantitative revolution. The quantitative revolution was a major turning point in geography in the 1950s and 60s (Marshall, 2006). It marked a change in the methods of geographical research, from descriptive (ideographic) geography to an emperical law making (nomothetic) geography. The quantitative revolution was based on basic ideals of logical positivism; that only one scientific method exists, that knowledge is neutral and value free, and that all science should be based on standards of accuracy and precision in the physical sciences.

There was a growing criticism against use of quantitative methodologies in the 1960s and 70s (Marshall, 2006). This was due to the positivist underpinnings of the approach. It was claimed that value free research was not possible in social research, and that quantification gave a false sense of objectivity. Quantitative researchers were also criticised for treating people as objects without consideration of the values and meaning that makes individuals human. It was argued that a purely quantitative approach looked at how things seemed to be, and not considering the human capacity to change the configuration of societies. As a result of this criticism, quantitative methodologies experienced a downturn in popularity in the 80s.

The GIS criticism in the 90s
The criticism of GIS in the early 1990s echoes the criticism of the quantitative revolution. A debate that had bubbled under the surface since the mid-1980s (Smith, 1992) was triggered by an editorial comment of Peter J. Taylor (1990) in Poltical Geography Quaterly. Here, Taylor writes about the "positivist geography's great revenge". He states that "quantifiers" have embraced GIS by retreating from knowledge to information, and "left geography intellectually sterile" as a "high-tech trivial pursuit".

The climate was not getting better by the strong academic advocacy of GIS (Smith, 1992). Openshaw (1991:628) was maybe the biggest provocateur by describing GIS as "an emerging all-embracing implicit framework capable of integrating and linking all levels of past, present, and possible future geographies". He was further fuelling the debate by calling GIS critics "poor fools" and "technical cripples". Another GIS critic, Neil Smith, was responding by saying: "the problem lies in outlandish diciplinary ambitions, the radical exclusion of other perspectives, and the dangerous and self-defeating renunciation of an intellectual (as opposed to technical) agenda that too often accompany the programmatic advocacy for GIS" (Smith, 1992).

The different arguments were assembled in a book called Ground Truth, edited by Pickles (1995). The book challenged geographers to examine the role of GIS in mediating power relations and political practises, producing spatial knowledge, and altering physical and social environments (Elwood, 2006). GIS was criticised in the ways it further privileged those in power, who had access to the technology, and marginalised others (Goodchild, 2006).

Many geographers thought that the advent of GIS created a biased perception of the academic discipline, as it only represented one lens to the physical and social world (Schuurman, 2004). Research projects not involving GIS, suffered from research grants and lack of attention. In the early 1990s, doctoral students looking for academic positions found that most of them required expertise in GIS. The new technology was seen as a direct threat to the positions of professional cartographers (Pickles, 2006). It is obvious that the large investments in GIS were streching the civility of sub-fields within geography departments.

Technical advances in GIS preceded the ability to understand its potential effects (Schuurman, 2004). As mentioned above, GIS did no derive its power solely from the field of geography, most came from outside (Openshaw, 1991). When GIS was introduced in geography it did not have a fixed and secure identity. There was, and still is, a myriad of ways GIS could be defied and perceived. For an academic researcher, GIS is not only a piece of software, but a scientific approach to a problem.


References
  • Goodchild, M., 2006, "GIScience Ten YEars After Ground Truth", Transactions in GIS, 10(5), pp. 687-692.
  • Marshall, A. 2006, "A critique of the development of quantitative methodologies in human geography", Radical Statistics, 92.
  • Openshaw, S., 1991 "A view on the GIS Crisis in Geography, or, using GIS to put Humpty Dumpty back together again", Environment and Planning A, 23, pp. 621-628.
  • Pickles, J. (ed), 1995, Ground Truth: The Social Implications of Geographical Information System, New York, guilford.
  • Schuurman, N., 2004, "Introducing the Identities of GIS" in GIS - a short introduction, pp. 1-3, Blackwell Publishing.
  • Smith, N., 1992, "History and philosophy of geography: real wars, theory wars", Progress in Human Geography, 16(2), pp- 257-2718.
  • Taylor. P.J., 1990, "GKS", Political Geography Quarterly, 3, pp. 211-212
  • Walton, J., 1995, "How real(ist) can you get?", Professional Geographer, 47, pp 61-65

Monday 10 May 2010

Thematic Mapping in Slovakia

Inspired by this website (thematicmapping.org), Vladimír Bačík created a great-looking site showing statistical data for Slovakia using Google Earth and KML.

Selected variables can be displayed on the territory of districts and regions, as well as the whole Slovak Republic. Various thematic mapping techniques are in use.


Give it a try!

Sunday 3 January 2010

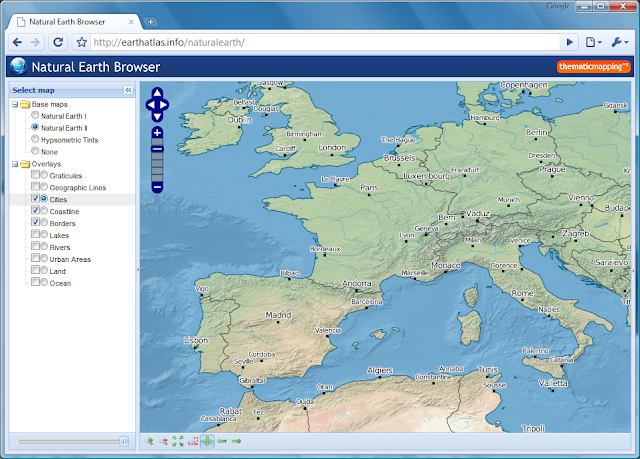
Natural Earth Browser

My holiday project, apart from skiing, was to play with the new Natural Earth dataset. This is a public domain map dataset available at three scales, 1:110m, 1:50m and 1:10m. By combing raster and vector data you can make a variety of visually pleasing maps. You can use my Natural Earth Browser to study the great linework of Natural Earth.


Natural Earth Browser consists of 13 map layers, 3 base maps and 10 overlays, which are shown in the original projection (Geographic, WGS84 datum). The map overlays are rendered as transparent map tiles. The layers can be reordered by drag-and-drop, and you can change the opacity of each layer with the slider control. Small scale data (1:110m) are shown for zoom level 1 and 2, medium scale data (1:50m) for zoom level 3 to 5, and large scale data (1:10m) for zoom level 6.

Natural Earth Browser was created with a variety of open source tools. Map tiles from raster data was created with MapTiler and optimised with pngng. Map tiles from vector data was styled with Mapnik and pre-genereated with TileCache. The map interface is based on OpenLayers, Ext JS and GeoExt.

The Natural Earth dataset is more than a collection of pretty lines. The vector data (shapefiles) are accompanied with attribute tables which can be used for styling and labeling purposes. I've just started digging into the styling capabilities of Mapnik, and I'm not realising the full potential of this toolkit. I had to spend some time skiing when natural earth looked like this:


I wish my readers a joyful and exciting new year!