Friday 9 September 2016

Creating TINs in SAGA GIS

This blog post is part of an ongoing effort to find the best open source tool for Triangulated Irregular Networks (TINs).

Nathan Saylor recommended me to try SAGA GIS, which has various tools for TINs. I've never used SAGA before (here is a quickstart tutorial), and the first challenge was to get it running on my MacBook. The easiest option was to use Homebrew:

brew tap osgeo/osgeo4mac
brew install saga-gis --with-app

I first converted my DEM into a grid format supported by SAGA, and also reduced the resolution from 10m to 100m to avoid out-of-memory issues on my laptop: 

gdal_translate -of GSBG -outsize 600 600 jotunheimen.tif jotunheimen_100m.grd

My SAGA installation is a bit rusty. I need to open the dataset twice ("File > Grid > Load" or by using the File System tree) before it actually loads. 


You'll see your dataset in the Data Manager. Above the datasets your see some numbers: 

100; 600x 600y; 432050x 6790050y

The first number is the cell size (100 meters), the next two numbers show the number of cells in x and y direction (600 x 600 px), and the last two numbers are the origin of the grid (my dataset is in UTM 32N). 

You'll find the TIN tools under Geoprocessing > TIN > Conversion: 


Unfortunately, the tools are poorly documented, so we need to experiment a bit. When I tried "Grid to TIN" I got (599 x 599 * 2 = 717,602 triangles for my 600 x 600 = 360,000 pixels, which is not very efficient. This is similar to the technique I used to create a triangle mesh in three.js


We need to to better, and "Grid to TIN (Surface Specific Points)" gives you some more options:


I'm not sure how the different methods are working, and if they can be combined by setting different thresholds below. Please give me some hints if you know some theory and best practices for terrains like this. 

I first used the defaults (Opposite Neighbours). I'm not friends yet with the map/3D-viewer of SAGA, so I'm exporting my TIN so I can enjoy it in other applications. The export tool is hidden under Geoprocessing > File -> Shapes -> Exports -> Export TIN to Stereo Lithography File (STL). 


I then opened the file in MeshLab:


Ok, it's promising, you can clearly see the big triangles for lakes, and smaller triangles when the terrain is rough. I got 172,128 triangles, about one-forth of a regular mesh. But it's not good enough, as I see that parts of the lakes are not horizontal. Which settings should I use to fix it? 

Still needs investigation: 
  • Is it possible to run TIN functions from SAGA on the command line? Does SAGA CMD work on Mac? 
  • How big dataset can SAGA handle? 

Do you want to contribute to this tutorial? Please add your comments below! 

Wednesday 7 September 2016

Creating a TIN from a raster DEM

NB! This blog post will constantly change until I find a good open source solution to create a Triangulated Irregular Network (TIN) from a Digital Elevation Model (DEM). Would you like to help? Please add a comment below!

NEW! Read the first test of the TIN capabilities of SAGA GIS.

People have already helped on Twitter, and I'll include some of these suggestions in this post.

My example DEM of Jotunheimen in Norway can be downloaded here (144 MB GeoTIFF). This is the same dataset I've used previously for my terrain mapping experiments with three.js and Cesium.


The goal now is to turn this raster DEM into a nice triangulated irregular network (TIN) optimised for 3D rendering. 

The dream solution would be a command line tool (part of GDAL?) that can turn a raster DEM into an optimised TIN.

Open source candidates: 


GIS StackExchange

Commercial tools: 

Sunday 21 August 2016

The history of the Telemark Canal - projected on a physical landscape model

Together with Jon Olav Eikenes and Christan Løverås, I'm part of a new startup called Norviz. The main focus so far has been on projecting animated graphics onto physical landscape models. Our first job was to tell the history of the Telemark Canal, a beautiful waterway connecting the sea and the interior through eight locks at a distance of 105 km from Skien to Dalen in Norway.


The installation was made for West Telemark museum, and is now on show in Vrangfoss, the largest lock complex on the canal with five locks and a lift of 23 metres. The 3D model displays a 10 minutes map animation showing the history of the canal together with historical images, voice and sound effects.

Here are some of the technical details which might interest my readers :-)

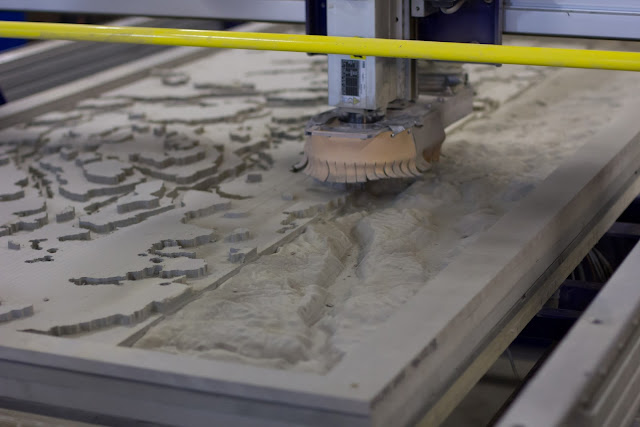
The digital elevation model was prepared in Blender and cutted with a a CNC router. It took the machine about 30 hours to finish the whole model.

Cutting a large 240x110 cm model of the Telemark Canal in Valchromat. 
Time-lapse of the cutting process:


After two coats of white paint, our model became a nice canvas for our map animation. Fun to see the geological structures from above.

Setup and calibration in an old barn at Vrangfoss. The video projector was mounted 4 meters above the model.   
The various maps telling the story of the canal was rendered with Mapnik before adding transitions and special effects in Adobe After Effects. With the help of three.js and some homemade scripts, we were able to align our map animation with the uneven landscape surface. Lastly we used JavaScript for Automation (JSX) to link and synchronise the the different parts of the installation.

The final installation showing graphics projected on the physical landscape model. 
From Varden newspaper 28 June 2016.

See it live at Vrangfoss during summer season while the canal boats are operating!

Are you interested in collaborating with us or help us fill the world with engaging visualizations? Please don’t hesitate contacting us!


Map data from Kartverket.
Concept and story by Indici and West Telemark museum.
Photos above taken by Jon Olav Eikenes.

Saturday 16 April 2016

Finding your way with OpenStreetMap

OpenStreetMap is not only for streets, it also contains an impressive amount of hiking trails. I’m currently planning a a week’s hike in June, crossing the Alps from Oberstdorf to Vernago. How can I extract the route from OpenStreetMap and use it on my GPS?

The route visualised in CartoDB. Interactive version.
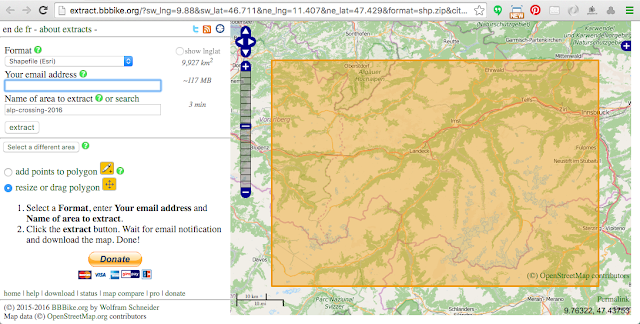
The BBBike extract service allows you to download OSM data for your region of choice.

You can select your area of interest by using the map interface, or by specifying the map bounds coordinates. 
I selected an area covering the entire route, and ordered the data in a Shapefile format. Within a minute I received an email with a download link.

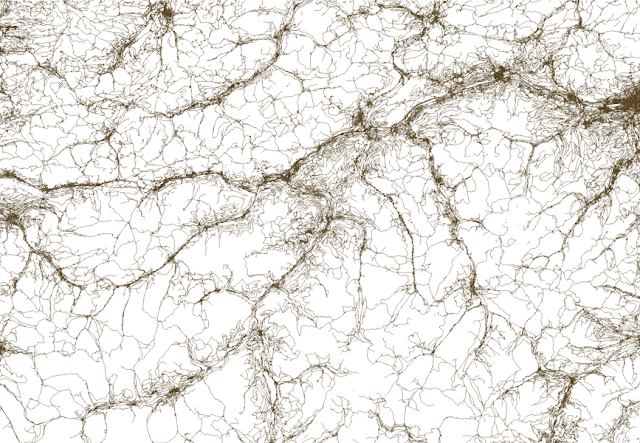
The extract contains 8 shapefiles, and we only need the roads shapefile, which also contains hiking trails. If I open the shapefile in QGIS it looks like this:

Roads and hiking trails in the Alps.  
You'll have great difficulties finding your trail on this map, so let's add a basemap from OpenStreetMap.  Save this as an XML file on your computer:


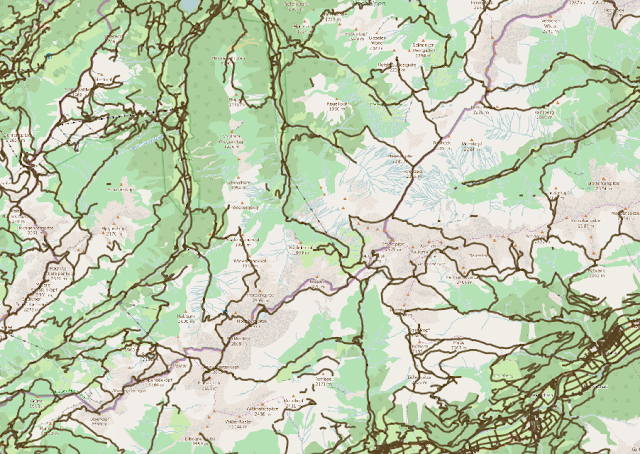
Drag the file onto your QGIS dashboard. If you do this before loading the roads shapefile you'll make sure that they are displayed in the same projection, and that the roads and trails are shown on top:

OSM road network shown on top of OSM map tiles in QGIS.
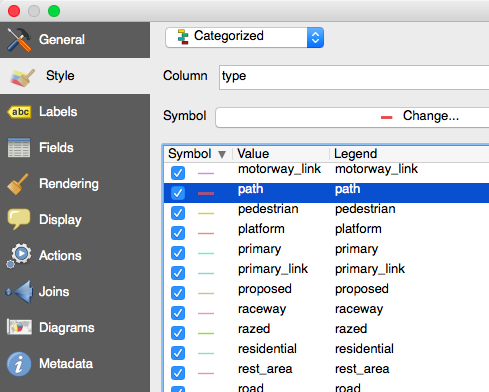
It's still hard to distinguish hiking trails from roads, as they all look the same. We can easily change the style of hiking trails in the style editor:

Select categorized style and give the path type an extra boost so it stands out on the map. 
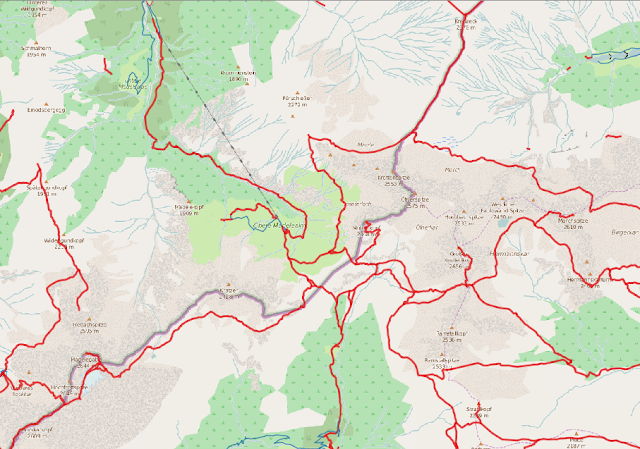
The paths are now easier to see:

Paths marked in red.
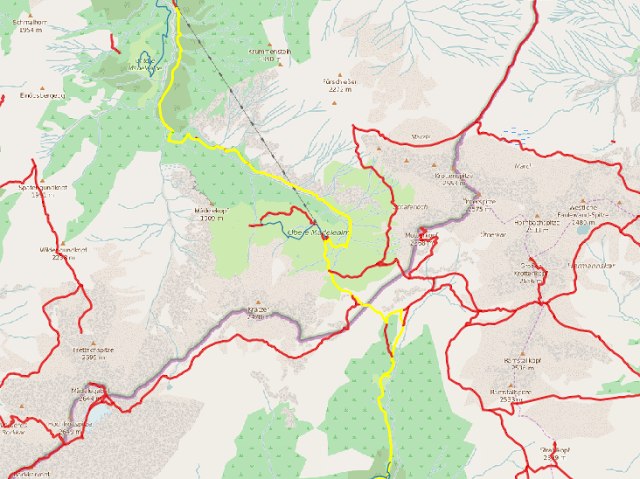
Next we need to select the path we plan to follow. Use the "Select Features(s)" tool and click on the path segments you plan to follow.


Select the path segments you plan to follow. 
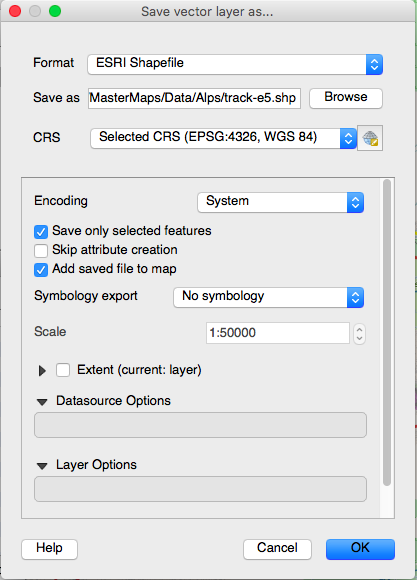
When you've marked your route, you can right click the roads layer and select "Save As...". Check that you only want to save selected features:

Save your track as a new shapefile.
It's best to have your route as a continuous line (or one for each day if you're on a long trek), and you can use the "Join multiple lines" plugin in QGIS to achieve this. The plugin will also handle gaps in your route by drawing a direct line between them.

Just select the full path and click on "Join multiple lines". Save the results. 

We now have a shapefile of our planned hiking route, thanks to OpenStreetMap, BBbike and QGIS.

Next, I want to upload the shapefile to CartoDB to create an interactive map showing of the route (also shown as the first image above). You can also study the route on top of detailed aerial imagery from Bing on my tracking site:

Interactive version (click on "Route" in the top menu.
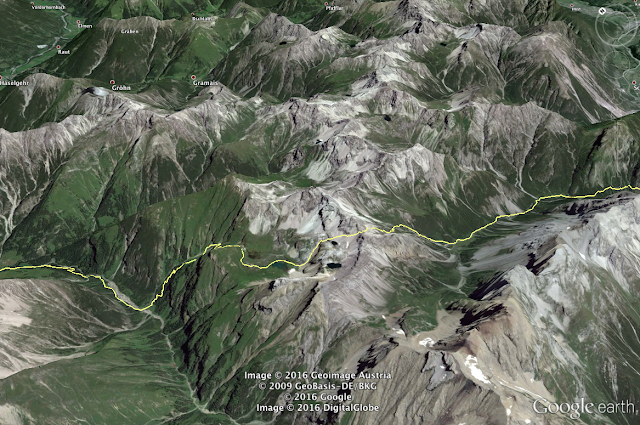
You can also save your track as a KML file in QGIS, and open it in Google Earth - a great way of getting a visual impression of the hike before you go.

Planning your hike with Google Earth. 

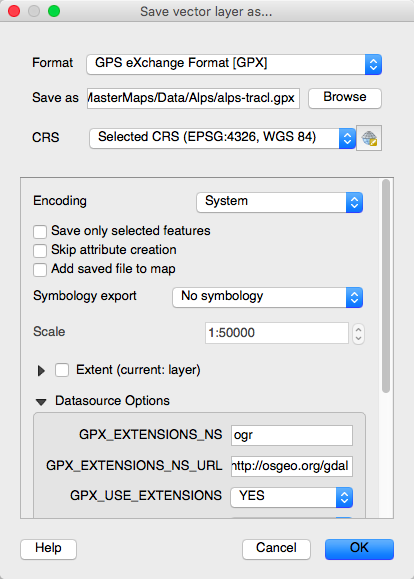
The last step is to upload the track to your GPS so you can use it for navigation. Open the track shapefile in QGIS, and save it in the GPX format.

Right click the track layer and select "Save As..."

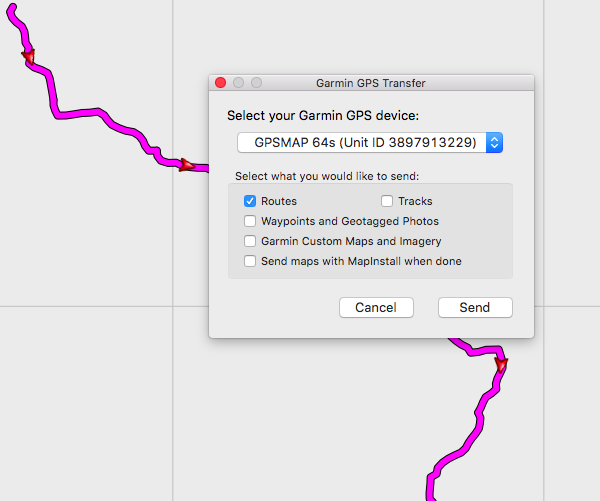
I then use Garmin Basecamp to transfer the route to my GPS:

Transfer the route to your GPS device.
Then we're ready for takeoff!