 (The population prism map is from Edmar Moretti's Brazilian version of the Thematic Mapping Engine. The highest prism is São Paulo, with its metropolitan area ranking seventh among the largest urban areas in the world.)
Friday 19 December 2008
Merry Christmas and Happy New Year!
I need a vacation from blogging and computers, so I'm going to take one. Have a great Christmas and a Happy New Year! I'll be back in 2009.
 (The population prism map is from Edmar Moretti's Brazilian version of the Thematic Mapping Engine. The highest prism is São Paulo, with its metropolitan area ranking seventh among the largest urban areas in the world.)
(The population prism map is from Edmar Moretti's Brazilian version of the Thematic Mapping Engine. The highest prism is São Paulo, with its metropolitan area ranking seventh among the largest urban areas in the world.)
Monday 15 December 2008
Michael Jones, Google Earth Chief Technologist, in live webcast at AGU Fall meeting today
 The lecture is titled The Spread of Scientific Knowledge from the Royal Society to Google Earth and Beyond and will be given at 6:30 pm San Francisco time.
 Watch AGU webcast
Saturday 13 December 2008
Thematic mapping at Googleplex
After I handed in my MSc thesis in August, Google invited me to San Francisco to present my work. Yesterday, I gave a tech talk at Googleplex about the Thematic Mapping Engine (now open-source) and how KML and Google Earth could be improved to better support popular thematic mapping techniques. My slides are available on SlideShare.
My talk was filmed and will probably appear online. I was a bit nervous during the presentation, so its not my best performance :-&
Anyway, I really enjoyed the discussions with the geo developers, the lunch talks, and the guided tour around Googleplex. Thanks Google!

My talk was filmed and will probably appear online. I was a bit nervous during the presentation, so its not my best performance :-&
Anyway, I really enjoyed the discussions with the geo developers, the lunch talks, and the guided tour around Googleplex. Thanks Google!

The next event is the AGU 2008 Fall Meeting starting on Monday. I'm an invited speaker at the Virtual Globes at AGU session on Thursday.
Monday 8 December 2008
Thematic Mapping Engine: Source code and technical documentation now available
Many people have asked, - and today, I've released the source code of the Thematic Mapping Engine (TME) under a GPLv3 license. The engine takes statistical data, spatial features and thematic mapping parameters as input and returns a KMZ file. This file can be viewed in Google Earth, or other geobrowsers supporting the KML standard. TME can be accessed from a web interface or a PHP script.
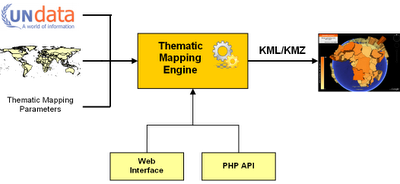
TME web interface
With the TME web interface, thematic maps can be created in a web browser, without a single line of code. This is achieved through an interactive web form where the user can select between statistical indicators and various thematic mapping techniques. Mapping parameters, like the colour and size, can be readily changed. The form returns a KMZ file which can be visualised directly in the web browser using the new Google Earth plug-in, or downloaded to a computer.
TME Application Programming Interface (API)
The Thematic Mapping Engine can also be used as an application programming interface (API). This allows thematic maps to be created with a few lines of PHP code. Existing or new applications can use this API to add thematic mapping functionality. This is the code required to create a choropleth map:
Requirements
The Thematic Mapping Engine requires the following software (all are open source and available free of charge):
This PDF document (7 Mb) gives a detailed description of the Thematic Mapping Engine. The documentation is available under a Creatice Commons Attribution-Share Alike License 3.0.
You should have a basic knowledge of PHP, MySQL and JavaScript before installing the Thematic Mapping Engine.
Download the TME source code on Google Code.
Enjoy!

TME web interface
With the TME web interface, thematic maps can be created in a web browser, without a single line of code. This is achieved through an interactive web form where the user can select between statistical indicators and various thematic mapping techniques. Mapping parameters, like the colour and size, can be readily changed. The form returns a KMZ file which can be visualised directly in the web browser using the new Google Earth plug-in, or downloaded to a computer.
TME Application Programming Interface (API)
The Thematic Mapping Engine can also be used as an application programming interface (API). This allows thematic maps to be created with a few lines of PHP code. Existing or new applications can use this API to add thematic mapping functionality. This is the code required to create a choropleth map:
include ('TME_MySQL_DataConnector.php');
include ('TME_Engine.php');
$dataConnector = new DataConnector();
$dataStore = $dataConnector->getDataStore(68, 2005, 0);
$parameters = array(
'mapType' => 'choropleth',
'indicator' => 68,
'year' => 2005,
'classification' => 'equal');
$map = new ThematicMap($dataStore, $parameters);
$file = $map->getKML();
Requirements
The Thematic Mapping Engine requires the following software (all are open source and available free of charge):
- PHP 5
- MySQL 5+
- Apache HTTP Server
- Ext JS 2.1
- Google Earth Plug-in
This PDF document (7 Mb) gives a detailed description of the Thematic Mapping Engine. The documentation is available under a Creatice Commons Attribution-Share Alike License 3.0.
You should have a basic knowledge of PHP, MySQL and JavaScript before installing the Thematic Mapping Engine.
Download the TME source code on Google Code.
Enjoy!
Sunday 7 December 2008
Thematic mapping techniques - a summary
Thematic maps have become a primary mechanism for summarising and communicating the increased volumes of geographically related information. This blog post is a short summary of the most common thematic mapping techniques.
Jaques Bertin (1967) established a graphic system of visual variables, which represents an universally recognized theory of the cartographic transcription of geographical information (Koch, 2001). Visual variables describe the perceived differences in map symbols that are used to represent geographical phenomena (Slocum et al., 2005). Bertin’s system has been subsequently modified by various cartographers, and the visual variables presented below are based on Slocum et al. (2007), which add 3-D symbolisation.
 (Image from InfoVis:Wiki)
Cartographers commonly distinguish between point, line, area and volume symbolisation (Robinson et al., 1995; Slocum et al., 2005). These distinctions may be summarised as follows:
A point symbol refer to a particular location in space, and is used when the geographical phenomena being mapped is located at a place or is aggregated to a given location (MacEachren, 1979). Differentiation among point symbols is achieved by using visual variables, like size, colour and shape. Common thematic mapping techniques using point symbols are dot maps and proportional symbol maps. On a dot map one dot represents a unit of some phenomena, and dots are placed at locations where the phenomenon is likely to occur (Slocum et al., 2005). A proportional symbol map is constructed by scaling symbols in proportion to the magnitude of data occurring at point locations. These locations can be true points or conceptual points, such as the centre of a country for which the data have been collected.
Line symbols are used to indicate connectivity or flow, equal values along a line and boundaries between unlike areas (MacEachren, 1979). Line symbols are differentiated on the basis of their form (e.g. solid line versus dotted line), colour and width. Common thematic mapping techniques using line symbols are flow maps and isarithmic maps. Flow maps utilise lines of differing width to depict the movement of phenomena between geographical locations (Slocum et al., 2005). Isarithmic maps depict smooth continuous phenomena, like rainfall or barometric pressure (Slocum etal., 2005).
Area symbols are used to assign a characteristic or value to a whole area on a map. Visual variables used for area symbols are colour, texture and perspective height (Slocum et al., 2005). The choropleth map is probably the most commonly employed method of thematic mapping, and is used to portray data collected for enumeration units, such as countries or statistical reporting units. While choropleth maps reflect the structure of data collection units, dasymetric maps assume areas of relative homogeneity, separated by zones of abrupt change. The country statistics used in the Thematic Mapping Engine can be considered as areal phenomena, because the statistical values are associated with political units specified as enclosed regions.
Volume symbols can be considered as 2½-D or true 3-D (Slocum et al. 2005). The first can be thought of as a surface, in which a geographical location is defined by x and y coordinate pairs and the value of the phenomenon is the height above a zero point. An example is prism maps which uses perspective height as the visual variable. 3-D symbols can be used to represent true 3-D phenomena, like the concentration of carbon dioxide (CO2) in the atmosphere or geological material underneath the earth’s surface (Slocum et al., 2005).
I'm interested in how these techniques can be represented in KML. You'll find several examples on this site. Please provide other examples by adding a comment. Especially, I would like to see examples of dot maps, flow maps, isarithmic maps and dasymetric maps in KML.
References:
- Bertin, J., 1967, "Semiologie Graphique", Paris
- Koch, W. G., 2001, "Jaques Bertin’s theory of graphics and its development and influence onmultimedia cartography", Information Design Journal 10(1), pp 37-43, John BenjaminPublishing Company
- MacEachren, A. M., 1979, "The Evolution of Thematic Cartography / A Research Methodology and Historical Review", The Canadion Cartographer Vol 16, No 1 June 1979, pp 17-33
- Robinson, A. H., Morrison, J.L., Muehrcke, P.C., Kimerling, A. J., Guptill, S. C., 1995, "Elements of Cartography", Sixth Edition, John Wiley & Sons
- Slocum, T. A., McMaster, R. B., Kessler, F. C., Howard, H. H., 2005, "Thematic Cartography and Geographic Visualization", Second Edition, Person Education Inc.
Subscribe to:
Posts (Atom)