
In the previous blog post we created a terrain map of Jotunheimen using color relief, hill and slope shading. All data originates from a single Digital Elevation Model (DEM). I miss two important features that dominates this area - lakes and glaciers. Let’s map it!
The Norwegian Mapping Authority has not yet released detailed land cover data in the public domain. Low resolution data can be found on this page (scale 1:1,500,000). Luckily, I found the Corine Land Cover dataset (scale 1:100,000) from the European Environment Agency (EEA). Reuse for commercial or non-commercial purposes is permitted free of charge, provided that EEA is acknowledged. I downloaded two shapefiles from this dataset, 335 - Glaciers and perpetual snow and 512 - Water bodies.
The Corine dataset is covering the whole of europe and use a different projection (EPSG:3035) than our map of Jotunheimen (EPSG:32632). Mapnik is able to clip and reproject vector data on-the-fly, so we can simply add the shapefiles to our Mapnik configuration file (jotunheimen_terrain3.xml):
I’ve added two styles for glaciers (white) and lakes (light blue) using the PolygonSymbolizer. The glacier layer is rendered on top of the color relief, before we blend it with with hill- and slopeshade layers. The lake layer is rendered on top of the blend. Since the shapefile and map projection is different, you have to specify the original projection in the srs attribute. Again, you’ll find the srs code by clicking on the Proj4 link on spatialreference.org.
Because of the large shapefiles, you need to specify the extent of the map (bbox) in the Python script that renders the image:
#!/usr/bin/env python
import mapnik
map = mapnik.Map(3134, 3134)
mapnik.load_map(map, 'jotunheimen_terrain3.xml')
bbox = mapnik.Box2d(mapnik.Coord(432000, 6790000), mapnik.Coord(492000, 6850000))
map.zoom_to_box(bbox)
mapnik.render_to_file(map, 'jotunheimen_terrain3.png')
The script will create this map image:
python jotunheimen_terrain.py
Viggo Lunde made me aware (see comment below) of a high resolution (scale 1:50,000) land cover dataset for Norway. The AR50 dataset (documentation) is available from the Norwegian Forest and Landscape Institute.
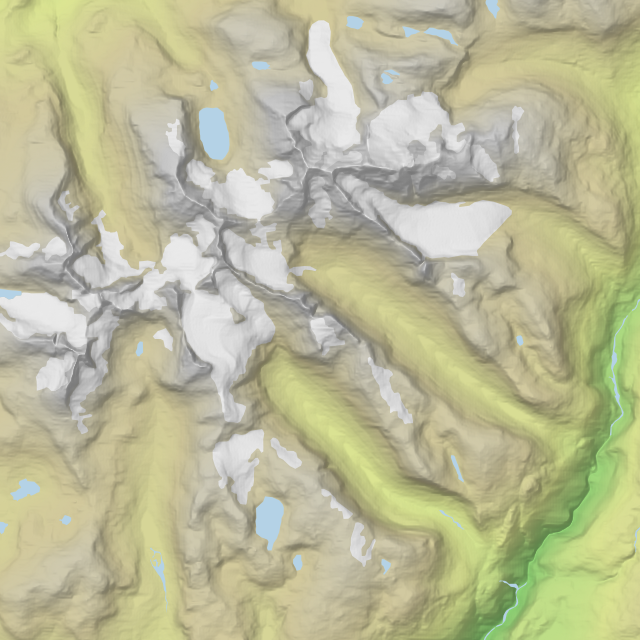
Jotunheimen is divided between two Norwegian counties - Sogn og Fjordane and Oppland. I downloaded the shapefiles for both counties and added them to jotunheimen_terrain_ar50.xml. The AR50 dataset contains many different land cover types, and I'm using filters in Mapnik to match styles to lake and glacier types: <style name="glacier style"> <rule> <filter>[ARTYPE] = 70</Filter> <polygonsymbolizer fill="rgb(255,255,255)" /> </Rule> </style>
This image shows Hurrungane mountain range rendered with AR50 data:
I’m quite happy with the result. In the next blog post we'll create an interactive version of this map.
I’ve added two styles for glaciers (white) and lakes (light blue) using the PolygonSymbolizer. The glacier layer is rendered on top of the color relief, before we blend it with with hill- and slopeshade layers. The lake layer is rendered on top of the blend. Since the shapefile and map projection is different, you have to specify the original projection in the srs attribute. Again, you’ll find the srs code by clicking on the Proj4 link on spatialreference.org.
Because of the large shapefiles, you need to specify the extent of the map (bbox) in the Python script that renders the image:
#!/usr/bin/env python
import mapnik
map = mapnik.Map(3134, 3134)
mapnik.load_map(map, 'jotunheimen_terrain3.xml')
bbox = mapnik.Box2d(mapnik.Coord(432000, 6790000), mapnik.Coord(492000, 6850000))
map.zoom_to_box(bbox)
mapnik.render_to_file(map, 'jotunheimen_terrain3.png')
The script will create this map image:
python jotunheimen_terrain.py
 |
| [ Download image ] |
---
UPDATE 9 July 2012: Viggo Lunde made me aware (see comment below) of a high resolution (scale 1:50,000) land cover dataset for Norway. The AR50 dataset (documentation) is available from the Norwegian Forest and Landscape Institute.
Jotunheimen is divided between two Norwegian counties - Sogn og Fjordane and Oppland. I downloaded the shapefiles for both counties and added them to jotunheimen_terrain_ar50.xml. The AR50 dataset contains many different land cover types, and I'm using filters in Mapnik to match styles to lake and glacier types: <style name="glacier style"> <rule> <filter>[ARTYPE] = 70</Filter> <polygonsymbolizer fill="rgb(255,255,255)" /> </Rule> </style>
This image shows Hurrungane mountain range rendered with AR50 data:
 |
| [ Download image ] |
---
I’m quite happy with the result. In the next blog post we'll create an interactive version of this map.
Comments
www.skogoglandskap.no or
http://www.skogoglandskap.no/kart/arealressurskart/artikler/2007/nedlasting_arealressurser
You could see the difference on kilden.skogoglandskap.no
Thanks for sharing!