
Finding your way with OpenStreetMap

OpenStreetMap is not only for streets, it also contains an impressive amount of hiking trails. I’m currently planning a a week’s hike in June, crossing the Alps from Oberstdorf to Vernago. How can I extract the route from OpenStreetMap and use it on my GPS?

The route visualised in CartoDB. Interactive version.
The BBBike extract service allows you to download OSM data for your region of choice.

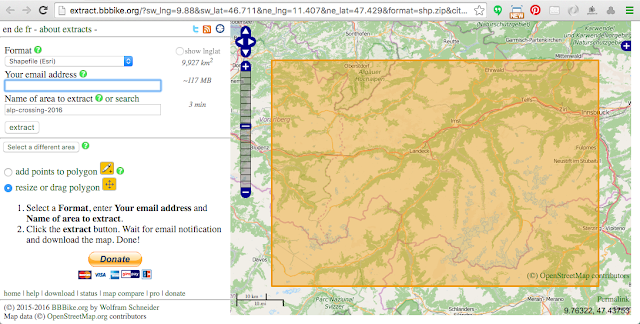
You can select your area of interest by using the map interface, or by specifying the map bounds coordinates. 
I selected an area covering the entire route, and ordered the data in a Shapefile format. Within a minute I received an email with a download link.

The extract contains 8 shapefiles, and we only need the roads shapefile, which also contains hiking trails. If I open the shapefile in QGIS it looks like this:

Roads and hiking trails in the Alps.  
You'll have great difficulties finding your trail on this map, so let's add a basemap from OpenStreetMap.  Save this as an XML file on your computer:


Drag the file onto your QGIS dashboard. If you do this before loading the roads shapefile you'll make sure that they are displayed in the same projection, and that the roads and trails are shown on top:

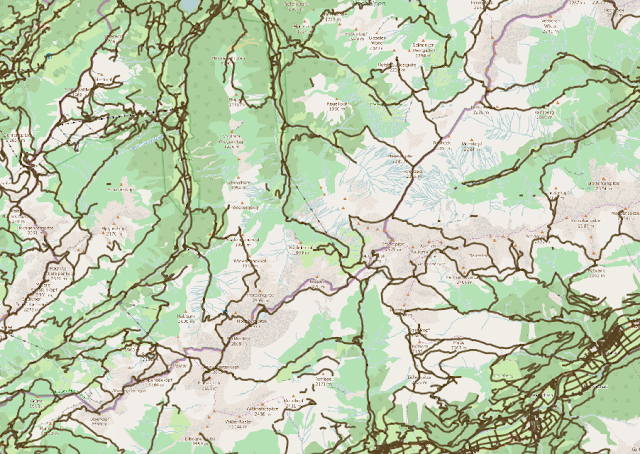
OSM road network shown on top of OSM map tiles in QGIS.
It's still hard to distinguish hiking trails from roads, as they all look the same. We can easily change the style of hiking trails in the style editor:

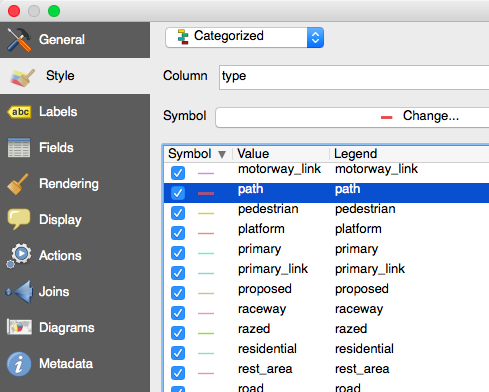
Select categorized style and give the path type an extra boost so it stands out on the map. 
The paths are now easier to see:

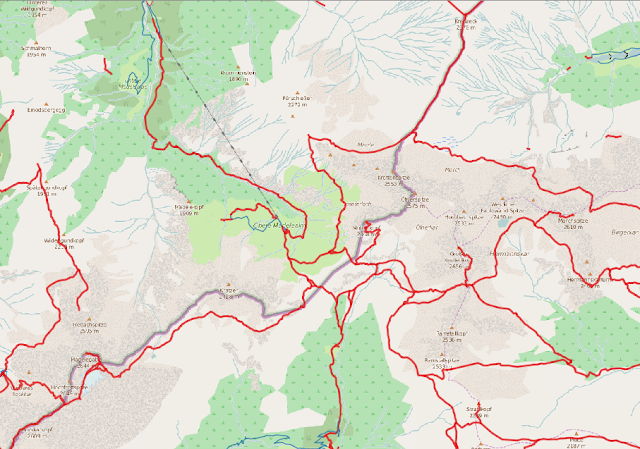
Paths marked in red.
Next we need to select the path we plan to follow. Use the "Select Features(s)" tool and click on the path segments you plan to follow.


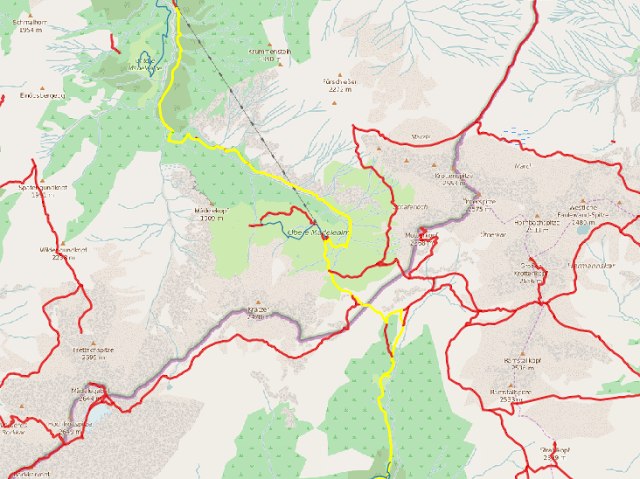
Select the path segments you plan to follow. 
When you've marked your route, you can right click the roads layer and select "Save As...". Check that you only want to save selected features:

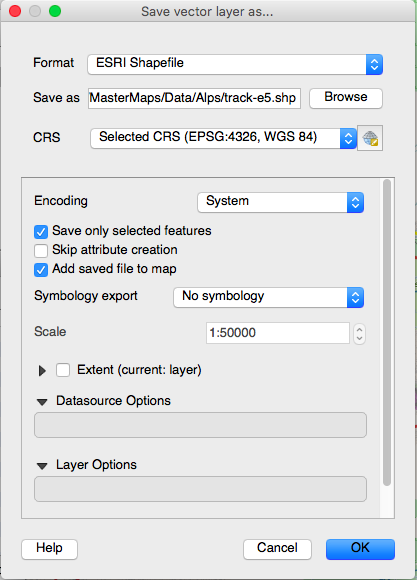
Save your track as a new shapefile.
It's best to have your route as a continuous line (or one for each day if you're on a long trek), and you can use the "Join multiple lines" plugin in QGIS to achieve this. The plugin will also handle gaps in your route by drawing a direct line between them.

Just select the full path and click on "Join multiple lines". Save the results. 

We now have a shapefile of our planned hiking route, thanks to OpenStreetMap, BBbike and QGIS.

Next, I want to upload the shapefile to CartoDB to create an interactive map showing of the route (also shown as the first image above). You can also study the route on top of detailed aerial imagery from Bing on my tracking site:

Interactive version (click on "Route" in the top menu.
You can also save your track as a KML file in QGIS, and open it in Google Earth - a great way of getting a visual impression of the hike before you go.

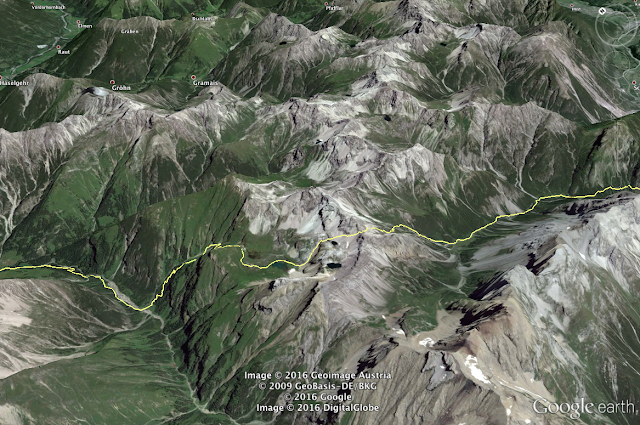
Planning your hike with Google Earth. 

The last step is to upload the track to your GPS so you can use it for navigation. Open the track shapefile in QGIS, and save it in the GPX format.

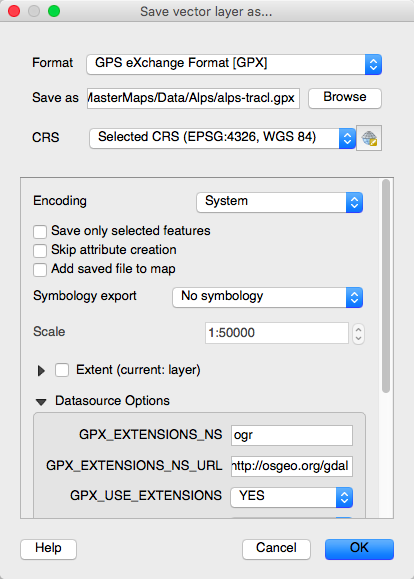
Right click the track layer and select "Save As..."

I then use Garmin Basecamp to transfer the route to my GPS:

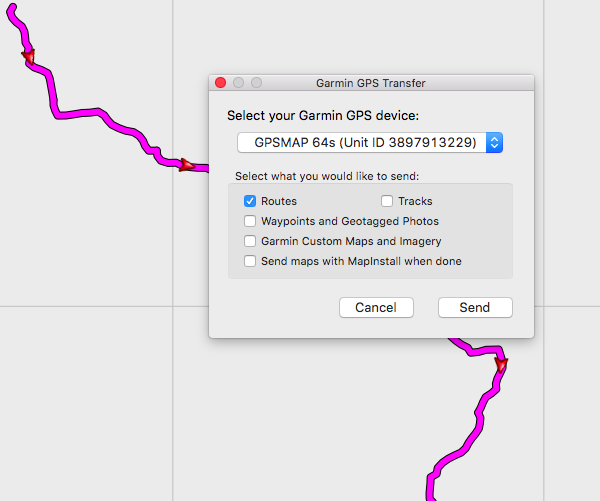
Transfer the route to your GPS device.
Then we're ready for takeoff!

Comments

Joshua said…
I always learn something from your posts! Thanks for all the education over time :)
Anonymous said…
Thank you very much. Me too, learning a lot from your posts. I admire your adventures of hike and ski.

Popular posts from this blog

Creating a WebGL Earth with three.js

This blog post will show you how to create a WebGL Earth with three.js , a great JavaScript library which helps you to go 3D in the browser. I was surprised how easy it seemed when reading a blog post  by Jerome Etienne . So I decided to give it a try using earth textures  from one of my favourite cartographers, Tom Patterson . WebGL is a JavaScript API for rendering interactive 3D graphics in modern web browsers without the use of plug-ins. Three.js is built on top of WebGL, and allows you to create complex 3D scenes with a few lines of JavaScript. If your browser supports WebGL you should see a rotating Earth below: [ Fullscreen ] To be able to display something with three.js, you need three things: a scene, a camera and a renderer. var width  = window.innerWidth,     height = window.innerHeight; var scene = new THREE.Scene(); var camera = new THREE.PerspectiveCamera(45, width / height, 0.01, 1000); camera.position.z = 1.5; var rende...

Thematic Mapping Engine

It's time to introduce the Thematic Mapping Engine (TME). In my previous blog posts, I've shown various techniques of how geobrowsers can be used for thematic mapping. The goal has been to explore the possibilites and to make these techniques available to a wider audience. The Tematic Mapping Engine provides an easy-to-use web interface where you can create visually appealing maps on-the-fly. So far only prism maps are supported, but other thematic mapping techniques will be added in the upcoming weeks. The engine returns a KMZ file that you can open in Google Earth or download to your computer. My primary data source is UNdata . The above visualisation is generated by TME ( download KMZ ) and shows child mortaility in the world ( UNdata ). The Thematic Mapping Engine is also an example of what you can achieve with open source tools and datasets in the public domain: A world border dataset is loaded into a MySQL database . The same database contains tables with statistics ...

Creating 3D terrains with Cesium

Previously, I’ve used three.js to create 3D terrain maps in the browser ( 1 , 2 , 3 , 4 , 5 , 6 ). It worked great for smaller areas, but three.js doesn’t have built-in support for tiling and advanced LOD algorithms needed to render large terrains. So I decided to take Cesium for a spin. Cesium is a JavaScript library for creating 3D globes and 2D maps in the browser without a plugin. Like three.js, it uses WebGL for hardware-accelerated graphics. Cesium allows you to add your own terrain data, and this blog post will show you how. Impressed by the terrain rendering in @CesiumJS - with a 10m elevation model for Norway! Farewell Google Earth. pic.twitter.com/RQKvfu2hBb — Bjørn Sandvik (@thematicmapping) October 4, 2014 Compared to  the dying Google Earth plugin , it's quite complicated to get started with Cesium. The source code is well documented and the live coding Sandcastle is great, but there is a lack of tutorials  and my development slows down when ...