
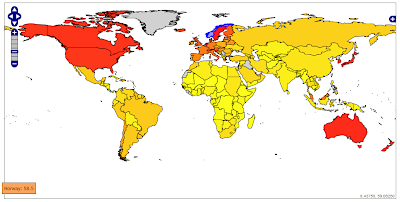
 Directions Magazine has an excellent introduction to GeoJSON. Open source tools like OpenLayers, GDAL/OGR, GeoServer and FeatureServer already supports the GeoJSON draft specification.
On the map above (number of Internet users), all countries are wrapped in a FeatureCollection. Each country is represented by a Feature containing MultiPolygon geometry and parameters. By using GeoJSON you are basically transferring vector data directly to the client instead of map images. This has several advantages:
- You can do client side processing of the data. One example is reprojecting of the data in the browser.
- The thematic display classifications or colour range can be changed without interfering the server.
- Possible to create a richer user interface (i.e. mouseover effects).
- No need for advanced map server software.
- Fast. The vector boundaries only needs to be downloaded once in a session.
The bottleneck is the vector rendering in the browser. The map above is rendered using a vector layer in OpenLayers. Depending on your browser, the polygons are rendered using SVG or VML. OpenLayers had great difficulties rendering my original world borders dataset. This dataset consists of 3775 polygons. By deleting "small" islands, I was able to reduce the number of polygons to 463. I have also greatly simplified the country borders, and reduced the number of lat/long decimals to two. The map now loads within a few seconds, even though it's a bit "shaky" in Internet Explorer. It works, but I find the boundaries oversimplified and not very useful.
 MapFish contains a GeoStat widget (still in alpha-release) that shows choropleth mapping in OpenLayers. The country borders and indicator values are retrieved as GeoJSON from the server. The colouring of the polygons is done through JavaScript in the web browser. As we see, a good performance can be achieved by only mapping African countries.
Conclusion: GeoJSON has a lot of potential, but is currently not suitable for world maps due to browser restrictions.
UPDATE 6 APRIL 2008: Read follow-up post on Technical Ramblings
Data source for Internet users: UNdata
Comments
Conclusion: GeoJSON has a lot of potential, but is currently not suitable for world maps due to browser restrictions.
"""
I disagree with this conclusion. GeoJSON is no worse than any other vector format. This is purely a browser limitation.
I have also done some experiments with OpenLayers vector-rendering for making Thematic maps but I'm having problems with performance when I have more than 100 polygons. I'm now working on a solution based on a WMS-service where a SLD-file is dynamicly generated on the server based on the request from the client.
Do you have any experiences on this?
The filtering technique in SLD is though rather limited. When doing the maps I first select eg 200 polygons in a layer that should be vizualized. Then on these 200 polygons I use a specific thematic rendering-scheme. When doing this in SLD I have to repeat the filter for each thematic class which I guess will degrade performance.
Michael Östling
I've not yet had time to look at a SLD/WMS solution. I will do at a later stage of my thesis.
You might have a look at European Interactive Atlas Explorer: http://karlinapp.ethz.ch/wms_client/
The top layers shows diagrams generated using SLD (look at the source code).
The diagrams are generated server side by the open source QGIS map server: http://karlinapp.ethz.ch/qgis_wms/
Maybe this tool will improve the performance? Please let me now if you have any success.
You already mentioned that you had to simplify geometries by reducing vertexes and removing some unnecessary islands. Instead of changing real data, you could do it by using databases which implemented OGC standards dynamically (eg. stsimplify). or you could write a serverside module that will reduce vertexes with using Douglas- Peucker algorithm (http://en.wikipedia.org/wiki/Ramer%E2%80%93Douglas%E2%80%93Peucker_algorithm).
Even though you use desktop technologies, showing 3775 polygon with its vertexes at the same time you will have troubles. Instead you could use scale based simplifying which is being done by most of the 3d games.
Also you can observe that maps.google.com renders 3d buildings in clientside (with using webgl). Even though webgl is a strong component, you can easily see they are also using some kind of vertex reducing algorithms dynamically (or with caching technologies scale by scale).
In conclusion, I can say that platform is defined, technologies are there but your solution was not a good one. Therefore, GeoJson is really good one but you cannot expect everyone to be capable to find good solutions which can use GeoJson.