
Natural Earth Browser

My holiday project, apart from skiing, was to play with the new Natural Earth dataset. This is a public domain map dataset available at three scales, 1:110m, 1:50m and 1:10m. By combing raster and vector data you can make a variety of visually pleasing maps. You can use my Natural Earth Browser to study the great linework of Natural Earth.


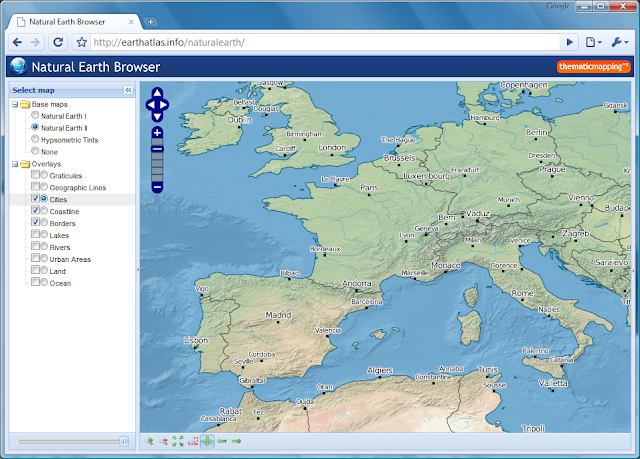
Natural Earth Browser consists of 13 map layers, 3 base maps and 10 overlays, which are shown in the original projection (Geographic, WGS84 datum). The map overlays are rendered as transparent map tiles. The layers can be reordered by drag-and-drop, and you can change the opacity of each layer with the slider control. Small scale data (1:110m) are shown for zoom level 1 and 2, medium scale data (1:50m) for zoom level 3 to 5, and large scale data (1:10m) for zoom level 6.

Natural Earth Browser was created with a variety of open source tools. Map tiles from raster data was created with MapTiler and optimised with pngng. Map tiles from vector data was styled with Mapnik and pre-genereated with TileCache. The map interface is based on OpenLayers, Ext JS and GeoExt.

The Natural Earth dataset is more than a collection of pretty lines. The vector data (shapefiles) are accompanied with attribute tables which can be used for styling and labeling purposes. I've just started digging into the styling capabilities of Mapnik, and I'm not realising the full potential of this toolkit. I had to spend some time skiing when natural earth looked like this:


I wish my readers a joyful and exciting new year!

Comments

Marc Oller said…
Bjørn,

good use of holidays. I really like the data presentation, layers order and performance of Natural Earth Browser.

Moreover, I would like information as it could integrate MapTiler raster data (I understand that the scheme used is TMS) with GeoExt JavaScript interface.
Bjørn Sandvik said…
Hi Marc,

Using MapTiler raster data with GeoExt is quite easy. MapTiler generates the TMS tiles and the OpenLayers code you need (layer definition).

TileCache is not yet supporting TMS storage, but you can use "GoogleDisk" to store the tiles in Z/X/Y.png format - and then use OpenLayers.Layer.XYZ to load the tiles.

The best way to learn GeoExt is to look at the examples: http://www.geoext.org/examples.html

Bjørn
Marc Oller said…
Thank you Bjørn,

Marc
Fabien said…
Great application ! I wanted to do it, but you were faster.

It seems that the magnifier_zoom_box icon is the same as http://geotribu.net/applications/baselayers/index.php :-)
Jill S-S said…
Hi Bjørn,
This is really fantastic. Just wondering, do the tools you've used support "clip, zip, and ship"? I'd been thinking it wold be a valuable service to people to be able to extract and download layers of interest by area of interest. Not asking you to do it (!), just wondering if this capability exists with these OS tools. :-)
Thanks and happy New Year, Jill S-S
Xan Gregg said…
Excellent work.

It looks like your raster layers contain lakes and rivers, but the raster images I've looked at from naturalearthdata.com do not have lakes and rivers. Did you add them from the vector files or am I looking in the wrong place?
Bjørn Sandvik said…
Hi Xan,

Yes, you can download raster images with lakes and rivers from naturalearthdata.com.

Bjørn
Xan Gregg said…
Thanks Bjørn. I found the versions with water features under the 1:10m resolution. I was only looking at the 1:50m data before.
Robert said…
Hi,
I really like your application using GeoExt with Openlayers. As the browser is using opensource software I was wondering if it would be possible to have a look at your code. In the Source the ../0.4/js/naturalearth.min.js file is encoded. I would like to use the code you used for the transparency of the layers. Any chance you could send it or provide it as a readable download?

thanks and great work!
Roxana said…
Hello Bjørn,

Great work!

Same question as Robert: is it possible to publish also the source code?
Unknown said…
Hi, just wanted to tell that the next version of Marble (http://edu.kde.org/marble) will make extensive use of the Natural Earth data (vector and raster data set). In fact we'll replace our current outdated Atlas layer with that one. This will include dynamic colorization mapping onto different projections, switching on/off layers, etc.

Popular posts from this blog

Creating a WebGL Earth with three.js

This blog post will show you how to create a WebGL Earth with three.js , a great JavaScript library which helps you to go 3D in the browser. I was surprised how easy it seemed when reading a blog post  by Jerome Etienne . So I decided to give it a try using earth textures  from one of my favourite cartographers, Tom Patterson . WebGL is a JavaScript API for rendering interactive 3D graphics in modern web browsers without the use of plug-ins. Three.js is built on top of WebGL, and allows you to create complex 3D scenes with a few lines of JavaScript. If your browser supports WebGL you should see a rotating Earth below: [ Fullscreen ] To be able to display something with three.js, you need three things: a scene, a camera and a renderer. var width  = window.innerWidth,     height = window.innerHeight; var scene = new THREE.Scene(); var camera = new THREE.PerspectiveCamera(45, width / height, 0.01, 1000); camera.position.z = 1.5; var rende...

Thematic Mapping Engine

It's time to introduce the Thematic Mapping Engine (TME). In my previous blog posts, I've shown various techniques of how geobrowsers can be used for thematic mapping. The goal has been to explore the possibilites and to make these techniques available to a wider audience. The Tematic Mapping Engine provides an easy-to-use web interface where you can create visually appealing maps on-the-fly. So far only prism maps are supported, but other thematic mapping techniques will be added in the upcoming weeks. The engine returns a KMZ file that you can open in Google Earth or download to your computer. My primary data source is UNdata . The above visualisation is generated by TME ( download KMZ ) and shows child mortaility in the world ( UNdata ). The Thematic Mapping Engine is also an example of what you can achieve with open source tools and datasets in the public domain: A world border dataset is loaded into a MySQL database . The same database contains tables with statistics ...

Creating 3D terrains with Cesium

Previously, I’ve used three.js to create 3D terrain maps in the browser ( 1 , 2 , 3 , 4 , 5 , 6 ). It worked great for smaller areas, but three.js doesn’t have built-in support for tiling and advanced LOD algorithms needed to render large terrains. So I decided to take Cesium for a spin. Cesium is a JavaScript library for creating 3D globes and 2D maps in the browser without a plugin. Like three.js, it uses WebGL for hardware-accelerated graphics. Cesium allows you to add your own terrain data, and this blog post will show you how. Impressed by the terrain rendering in @CesiumJS - with a 10m elevation model for Norway! Farewell Google Earth. pic.twitter.com/RQKvfu2hBb — Bjørn Sandvik (@thematicmapping) October 4, 2014 Compared to  the dying Google Earth plugin , it's quite complicated to get started with Cesium. The source code is well documented and the live coding Sandcastle is great, but there is a lack of tutorials  and my development slows down when ...