
I want to play with my new seafloor map in TileMill, which is a great map design studio. It’s built on top of Mapnik, but instead of XML you can style your maps with CartoCSS, which is much more user friendly. The biggest limitation of TileMill is that it only supports the Web Mercator projection (even though the underlying rendering engine, Mapnik, handles multiple map projections very well). Hopefully, TileMill will add support for other map projections and custom tiling schemes in the future.
Web Mercator is clearly not the ideal map projection to use for countries far north, like Norway (use UTM 33N), or countries not so far south, like New Zealand (use NZTM2000). Another problem with Web Mercator, and other projections centered at the prime meridian, is that you often get troubles crossing the antimeridian on the opposite side. This is unfortunate for New Zealand, where the animeridian is just east of the North Island, leaving the Chatham Islands on the other side. When I tried to reproject my seafloor map into Web Mercator, I got a dataset that made a roundtrip around the Earth. This blog post tells you how to avoid this trip by dividing the source dataset into two parts.
You’ll see that this seafloor map is different from the one I created earlier, as I’ve masked out the islands with a white color. I did this with Mapnik XML using this LINZ dataset. I want to add land data as separate layers in TileMill.
The seafloor map of New Zealand is 12,000 x 15,200 pixels and it crosses the antimeridian (180° longitude). This is not a problem with the original map projection, as it’s centered at 100° east longitude, and not the prime meridian (0° longitude). What happens if we reproject the dataset into Web Mercator
gdalwarp -s_srs "+proj=merc +lon_0=100 +lat_ts=-41 +x_0=0 +y_0=0 +datum=WGS84 +units=m +no_defs" -t_srs EPSG:3785 -co compress=lzw -r bilinear nz-seafloor.tif nz-seafloor-webmerc.tif
(To use Mercator 41 with gdalwarp you need to specify the full Proj4-definition.)
The result is a very wide image spanning the globe (and I’m not able to get the same resolution as the original image):

Instead of this wide image, I decided to split the image in two at the antimeridian with gdal_translate:
gdal_translate -srcwin 0 0 7723 15200 -co compress=lzw nz-seafloor.tif nz-seafloor-1.tif
gdal_translate -srcwin 7724 0 4276 15200 -co compress=lzw nz-seafloor.tif nz-seafloor-2.tif

This will create two new map images, one on each side of the antimeridian. There is one column of pixels, which was unfortunate enough to cross the antimerdian, that is now missing.
Next, I’m reprojecting both images into Web Mercator using gdalwarp:
gdalwarp -s_srs "+proj=merc +lon_0=100 +lat_ts=-41 +x_0=0 +y_0=0 +datum=WGS84 +units=m +no_defs" -t_srs EPSG:3785 -co compress=lzw -r bilinear nz-seafloor-1.tif nz-seafloor-1-webmerc.tif
gdalwarp -s_srs "+proj=merc +lon_0=100 +lat_ts=-41 +x_0=0 +y_0=0 +datum=WGS84 +units=m +no_defs" -t_srs EPSG:3785 -co compress=lzw -r bilinear nz-seafloor-2.tif nz-seafloor-2-webmerc.tif
Because of the missing pixel, the images don’t overlap entirely at the antimeridian. I’m therefore stretching the images a tiny bit (which is not recognizable at this scale) to make it seamless:
gdal_translate -a_ullr 17482842.051 -7842209.647 20037508.34 -2796127.081 -co compress=lzw nz-seafloor-1-webmerc.tif nz-seafloor-1-webmerc-fix.tif
gdal_translate -a_ullr -20037508.34 -7842313.166 -18622711.547 -2796127.081 -co compress=lzw nz-seafloor-2-webmerc.tif nz-seafloor-2-webmerc-fix.tif
We now have to map images that we can load into TileMill, which will stitch them together again.

Web Mercator is clearly not the ideal map projection to use for countries far north, like Norway (use UTM 33N), or countries not so far south, like New Zealand (use NZTM2000). Another problem with Web Mercator, and other projections centered at the prime meridian, is that you often get troubles crossing the antimeridian on the opposite side. This is unfortunate for New Zealand, where the animeridian is just east of the North Island, leaving the Chatham Islands on the other side. When I tried to reproject my seafloor map into Web Mercator, I got a dataset that made a roundtrip around the Earth. This blog post tells you how to avoid this trip by dividing the source dataset into two parts.
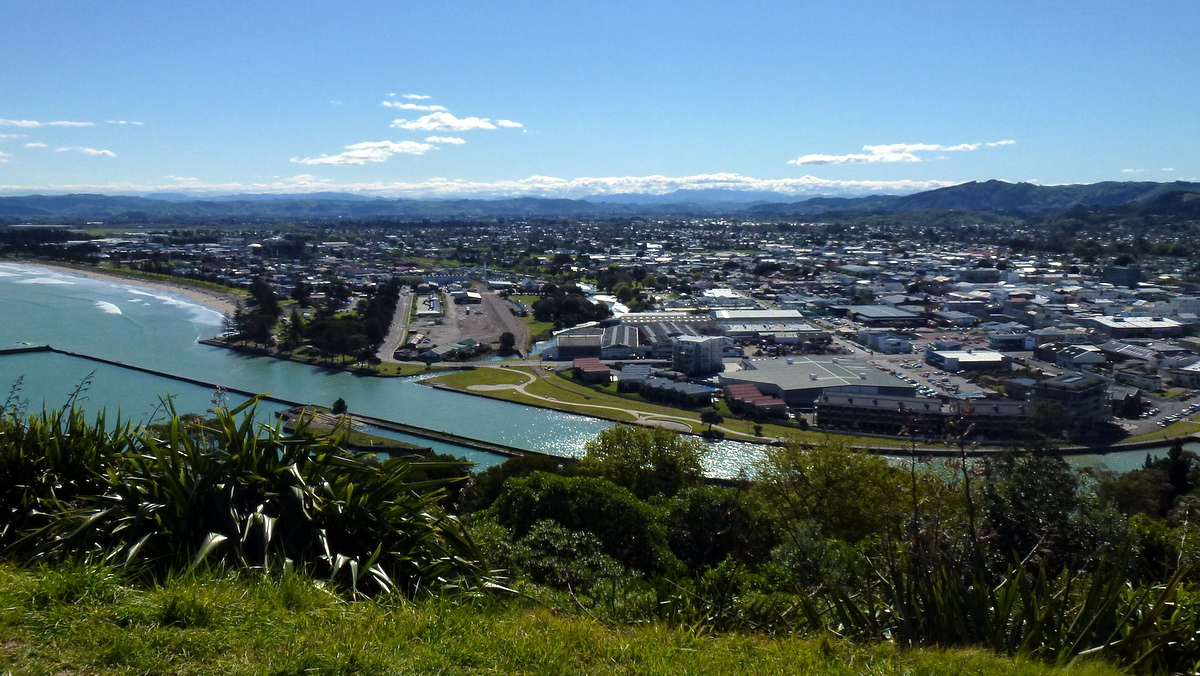 |
| Gisborne, in northeastern New Zealand, proudly claims to be the first city in the world to greet the sun each day. |
You’ll see that this seafloor map is different from the one I created earlier, as I’ve masked out the islands with a white color. I did this with Mapnik XML using this LINZ dataset. I want to add land data as separate layers in TileMill.
The seafloor map of New Zealand is 12,000 x 15,200 pixels and it crosses the antimeridian (180° longitude). This is not a problem with the original map projection, as it’s centered at 100° east longitude, and not the prime meridian (0° longitude). What happens if we reproject the dataset into Web Mercator
gdalwarp -s_srs "+proj=merc +lon_0=100 +lat_ts=-41 +x_0=0 +y_0=0 +datum=WGS84 +units=m +no_defs" -t_srs EPSG:3785 -co compress=lzw -r bilinear nz-seafloor.tif nz-seafloor-webmerc.tif
(To use Mercator 41 with gdalwarp you need to specify the full Proj4-definition.)
The result is a very wide image spanning the globe (and I’m not able to get the same resolution as the original image):

Instead of this wide image, I decided to split the image in two at the antimeridian with gdal_translate:
gdal_translate -srcwin 0 0 7723 15200 -co compress=lzw nz-seafloor.tif nz-seafloor-1.tif
gdal_translate -srcwin 7724 0 4276 15200 -co compress=lzw nz-seafloor.tif nz-seafloor-2.tif

This will create two new map images, one on each side of the antimeridian. There is one column of pixels, which was unfortunate enough to cross the antimerdian, that is now missing.
Next, I’m reprojecting both images into Web Mercator using gdalwarp:
gdalwarp -s_srs "+proj=merc +lon_0=100 +lat_ts=-41 +x_0=0 +y_0=0 +datum=WGS84 +units=m +no_defs" -t_srs EPSG:3785 -co compress=lzw -r bilinear nz-seafloor-1.tif nz-seafloor-1-webmerc.tif
gdalwarp -s_srs "+proj=merc +lon_0=100 +lat_ts=-41 +x_0=0 +y_0=0 +datum=WGS84 +units=m +no_defs" -t_srs EPSG:3785 -co compress=lzw -r bilinear nz-seafloor-2.tif nz-seafloor-2-webmerc.tif
Because of the missing pixel, the images don’t overlap entirely at the antimeridian. I’m therefore stretching the images a tiny bit (which is not recognizable at this scale) to make it seamless:
gdal_translate -a_ullr 17482842.051 -7842209.647 20037508.34 -2796127.081 -co compress=lzw nz-seafloor-1-webmerc.tif nz-seafloor-1-webmerc-fix.tif
gdal_translate -a_ullr -20037508.34 -7842313.166 -18622711.547 -2796127.081 -co compress=lzw nz-seafloor-2-webmerc.tif nz-seafloor-2-webmerc-fix.tif
We now have to map images that we can load into TileMill, which will stitch them together again.

Comments