New Zealand is the perfect country to map, not only because of all the free data available - it also has a very interesting topography, above
and below the sea surface. Actually, around 95 percent of New Zealand’s territory is under water. So I wanted to start off my mapping tour by creating a seafloor map of New Zealand.
 |
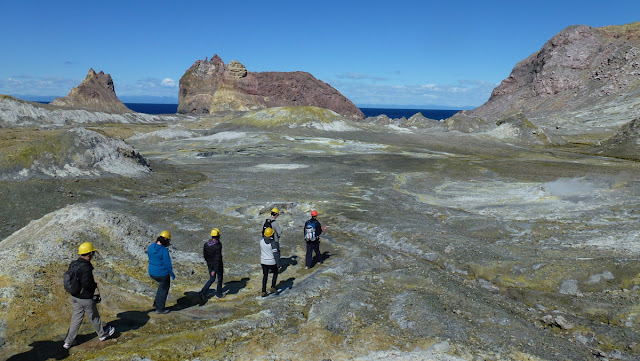
| On my way to Whakaari / White Island, New Zealand’s only active marine volcano. Why is it there and what's hiding below the surface? |
You can get
bathymetry data (underwater depth) from the
National Institute of Water and Atmospheric Research (NIWA). The dataset covers New Zealand's Exclusive Economic Zone and is free to use for non-commercial purposes (
terms and conditions).
This page describes how the data was collected. I downloaded the “NZ 250m ESRI ASCII grid 530Mb” version of the dataset.
The zip containes two files, RegionalBathymetry2008.asc and RegionalBathymetry2008.prj. The first file contains the actual data in an
ASCII grid format. The last file contains information about the projection used, and if you open this file in a text editor it will show you this information:
Projection    MERCATOR
Datum         WGS84
Spheroid      WGS84
Units         METERS
Zunits        NO
Xshift        0.0
Yshift        0.0
Parameters
 100  0  0.0 /* longitude of central meridian
 -41  0  0.0 /* latitude of true scale
0.0 /* false easting (meters)
0.0 /* false northing (meters)
What does it tell us?
- The dataset is in a Mercator projection. This is clearly not the best map projection to use for New Zealand, but the "official" projection, New Zealand Transverse Mercator 2000 (NZTM2000), is only applicable for the main New Zealand island group.
- It’s using the WGS84 spheroid.
- The coordinate unit is meters.
- The central meridian is not the prime meridian (0° longitude), but 100° east longitude. This is useful, as we avoid problems with the antimeridian (180° longitude), which is passing through the area. I’ll explain these problems in a later blog post.
- The scale of a map using this projection will only be true at 41° south latitude, running through the Cook Strait between the North and South Islands.
The code for this projection in
ESPG:3994 and the Proj4 definition (we'll use this one later) is "+proj=merc +lon_0=100 +lat_ts=-41 +x_0=0 +y_0=0 +datum=WGS84 +units=m +no_defs".
You can use the
gdalinfo command to obtain more information about the dataset:
gdalinfo -mm RegionalBathymetry2008.asc
Driver: AAIGrid/Arc/Info ASCII Grid
Files: RegionalBathymetry2008.asc
       RegionalBathymetry2008.prj
Size is 12115, 15391
Coordinate System is:
PROJCS["unnamed",
    GEOGCS["WGS 84",
        DATUM["WGS_1984",
            SPHEROID["WGS 84",6378137,298.257223563,
                AUTHORITY["EPSG","7030"]],
            TOWGS84[0,0,0,0,0,0,0],
            AUTHORITY["EPSG","6326"]],
        PRIMEM["Greenwich",0,
            AUTHORITY["EPSG","8901"]],
        UNIT["degree",0.0174532925199433,
            AUTHORITY["EPSG","9108"]],
        AUTHORITY["EPSG","4326"]],
    PROJECTION["Mercator_1SP"],
    PARAMETER["latitude_of_origin",100],
    PARAMETER["central_meridian",0],
    PARAMETER["scale_factor",1],
    PARAMETER["false_easting",-41],
    PARAMETER["false_northing",0],
    UNIT["METERS",1]]
Origin = (4795705.551502100200000,-2067845.457881099500000)
Pixel Size = (250.000000000000000,-250.000000000000000)
Corner Coordinates:
Upper Left  ( 4795705.552,-2067845.458)
Lower Left  ( 4795705.552,-5915595.458)
Upper Right ( 7824455.552,-2067845.458)
Lower Right ( 7824455.552,-5915595.458)
Center      ( 6310080.552,-3991720.458)
Band 1 Block=12115x1 Type=Float32, ColorInterp=Undefined
    Computed Min/Max=-3367.677,10069.260
  NoData Value=-9999
In addition to the projection facts, what does it tell us?
- The image or grid size is 12,115 x 15,391 pixels or cells.
- Each pixel or grid cell covers an area of 250 x 250 meters.
- The extent of the area is defined by four coordinate pairs. The size of the area is 3,028,750 x 3,847,750 meters.
- The image is single band and the debth data is stored as 32-bit floating-point numbers. The maximum depth is 10,669 meters. Interestingly, the minimum depth is -3,368 meters. This tells us that the dataset also contains onshore elevation data, and the lowest number is actually 3.368 meters above sea level. I’m not sure why this is almost 400 meters below the Mount Cook, the highest mountain in New Zealand (3,754 m).
Let’s add the information we’ve got on Google Earth:
The red area shows the extent of the dataset. The yellow lines show the equator and the central meridian (100° east longitude). The pin is located at the origin of the coordinate reference system (0, 0). The black line is at 41° south latitude, where we have true scale (250 meters per pixel). The resolution will be higher further south, and lower as we move north.
To make the calculations easier to follow, I’m going to crop the dataset a bit with
gdal_translate:
gdal_translate -projwin 4800000 -2100000 7800000 -5900000 -a_ullr 4800000 -2100000 7800000 -5900000 -co compress=lzw RegionalBathymetry2008.asc nz-bathymetry.tif
This command will create a dataset that has a size of 12,000 x 15,000 pixels within an area of 3,000,000 x 3,800,000 meters (3,000 x 3,800 km). The resolution is still 250 meters per pixel.
In the nextblog post we’ll start playing with the data.
----
A few more photos from White Island:
 |
| Towards the crater. |
 |
| Between July and August 2012 White Island showed signs of increased activity with lake and gas levels rising from inside the crater. On 5 August 2012 a minor eruption occurred, rising the alert level to 2 of 5. |
 |
| The main crater. Where's gollum?!? |
 |
| Walking on the moon. Virtually no vegetation survives the harsh acidic environment. |
 |
| Numerous failed attempts were made to mine sulphur from White Island. Before the days of antibiotics, sulphur was used in medicines as an antibacterial agent, in the making of match heads, and for sterilising wine corks. |


Comments