
I'm going to play with the mapping capabilitites of D3.js in my new blog series from Foldøy island. I would like to use data from my own country, Norway. This dataset needs some improvements, and this blog post will show you how to do merge polygons in QGIS.
As announced in an earlier blog post, Norway will open it's topographic datasets to the public. This week we got some details about the launch:
The dataset contains several shapefiles with point, line and polygon data. Let's open NO_AdminOmrader_pol.shp in QGIS:

We still have one extra municipality, and this one is due to a bug in the dataset (UPDATE: This is not a bug, Sandefjord really has an enclave named Himberg in the neighbouring municipality. You should merge these two features into a multipolygon instead of the solution described below). The municipality of Sandefjord has two entries in the attribute table, and if you zoom to those features you'll see that Sandefjord has an enclave in the neighbouring municipaliy of Larvik:
This is sadly not the truth, let's get rid of the enclave:
Click on the "Save Edits" button, and you have a shapefile with the correct number of municipalties in Norway! You'll also find the shapefile on GitHub ("NO_AdminOmrader_pol.shp").
In the next blog post, we'll do some polygon clipping with QGIS.
As announced in an earlier blog post, Norway will open it's topographic datasets to the public. This week we got some details about the launch:
- The data will be released on October 1st this year,
- The licence will be CC BY 3.0.
- Vector- and rasterdata at various scales up to 1:50,000 will be available.
- This includes administrative borders for counties and municipalities and driveable roads longer that 50 meters.
- Digital elevation data at 10x10 meter resolution, which is great news!
Before October 1st, I'm stuck with a dataset at 1:2,000,000 scale, but it will be suitable for country-wide mapping with D3.js. You can download the shapefiles from the Norwegian Mapping Authority on this page.
 |
| This image shows the level of detail of the N2000 dataset from the Norwegian Mapping Authority. I've placed a small blue marker on Foldøy island, we're I'm currently staying. |
The dataset contains several shapefiles with point, line and polygon data. Let's open NO_AdminOmrader_pol.shp in QGIS:

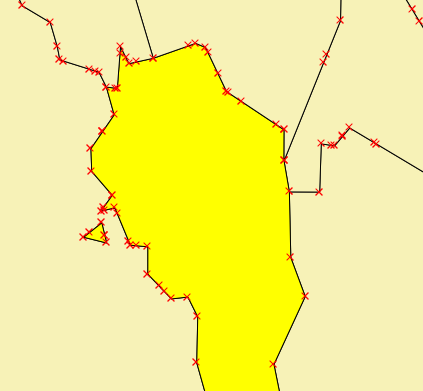
This shapefile contains polygons for all municipalities in Norway. If you open the attribute table you'll see that it's 430 features or municipalities, while the current numer is 428 (still far too many!). Municipalities in Norway are undergoing continuous consolidation, and this dataset is not up-to-date. January 1st this year, the municipality of Harstad and Bjarkøy was merged. Let's do the same in this dataset:
- Click on the "Toggle Editing" button.
- Open the attribute table and sort the municiaplities by name.
- Mark the municipality of "Harstad" and "Bjarkøy".
- Click on "Zoom map to the selected rows" if you want to locate the municipalities on the map.
- Click on the "Merge Selected Features" button.
- Keep the attributes for Harstad.
- In the attribute table, change the id ("KOMM") form 1901 to 1903.
 |
| The former municipalities of Harstad and Bjarkøy in Northern Norway. |
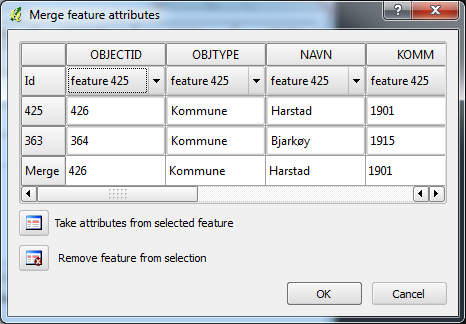 |
| Remember to take the attributes form the correct feature while merging. |
 |
| The enclave of the municipality of Sandefjord. |
This is sadly not the truth, let's get rid of the enclave:
- Click on the "Select Single Feature" button.
- While pressing Ctrl-key select the enclave and the surrounding polygon.
- Click on the "Merge Selected Features" button.
- Keep the attributes for Larvik.
Click on the "Save Edits" button, and you have a shapefile with the correct number of municipalties in Norway! You'll also find the shapefile on GitHub ("NO_AdminOmrader_pol.shp").
In the next blog post, we'll do some polygon clipping with QGIS.
 |
| Outdoor fireplace on Foldøy island - at midnight. |
Comments
/Jesper
Karen
When merging polygons, users should be aware that if they use duplicate function to preserve the original layer, it won't work as the master file will be corrupted. You can find a description of this bug at http://hub.qgis.org/issues/7540.
Paton