
Expedition mapping - from Oslo to Bergen by foot

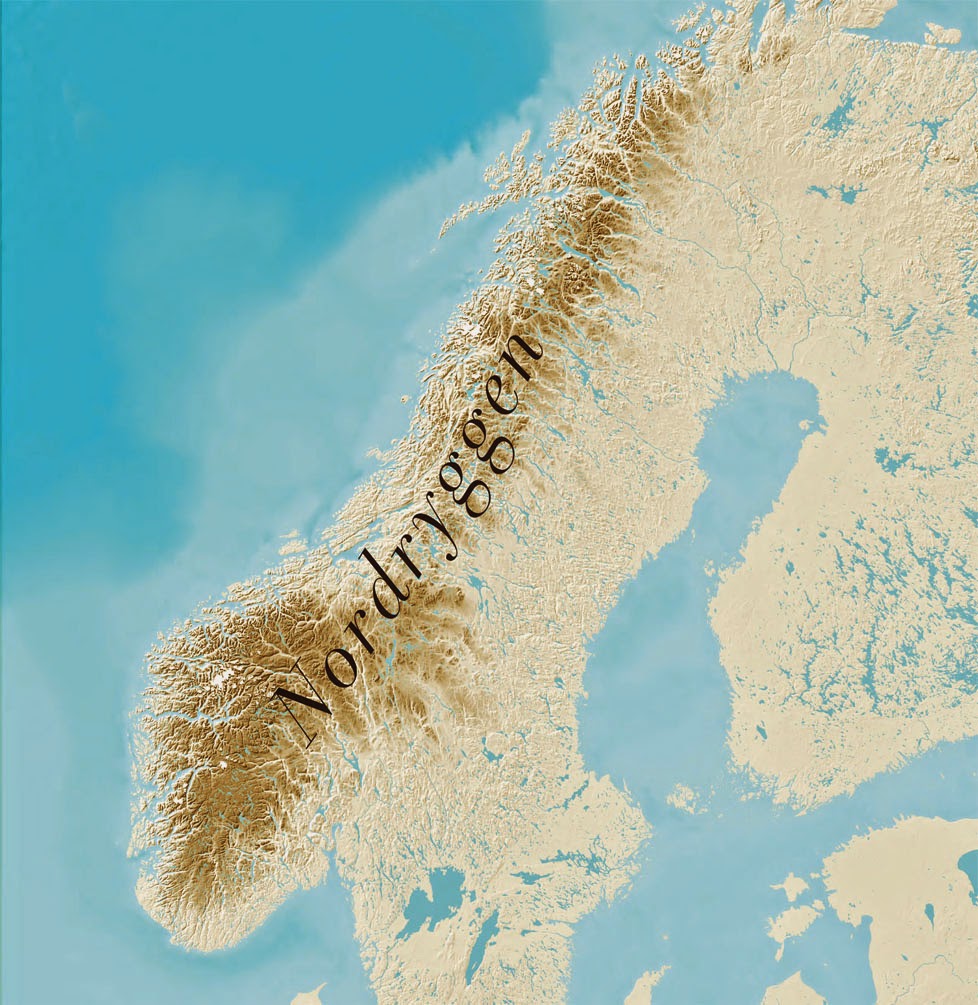
Nordryggen mountain range. Map from fjellkjeden.no.
This is my first blog post in a new series about expedition mapping. I'm currently preparing for a 4 week hike from Oslo to Bergen in August this year. I'll start in my hometown Oslo and walk through the wooden lowlands surrounding the city, Nordmarka. Then I'm heading for the mountains that will take me all the way to Bergen. I'll be crossing Europes longest mountain range, recently named Nordryggen ("the north ridge").  

Of course, maps will be important when preparing, while walking and to document the journey. I've started with a pile of good old paper maps to find the optimal route. I want to spend as much time as possible above the tree line, and it's clearly not the shortest route between the two cities. We have a great network of mountain trails and cabins in Norway, maintained by the Norwegian Trekking Association, and I'll use it's facilities when available. 

I've plotted the planned route on a Leaflet map, starting in the east and going westwards.


There are markers for cabins, and where my tent is the only alternative. A couple of shop markers show where it's possible to get some supplies. I've used the Leaflet.MakiMarkers plugin from James Seppi. This plugin allows you to create map markers using Maki Icons from MapBox. The background map is provided by the Norwegian Mapping Authority. My code is of course available on Github

In my next blog post, we'll look at real-time satellite tracking

Comments

Hugo Ahlenius said…
Would love to see a elevation profile of that hike!
Bjørn Sandvik said…
No, I had to cancel it due to external factors. Will try again in 2019 :-)

Popular posts from this blog

Creating a WebGL Earth with three.js

This blog post will show you how to create a WebGL Earth with three.js , a great JavaScript library which helps you to go 3D in the browser. I was surprised how easy it seemed when reading a blog post  by Jerome Etienne . So I decided to give it a try using earth textures  from one of my favourite cartographers, Tom Patterson . WebGL is a JavaScript API for rendering interactive 3D graphics in modern web browsers without the use of plug-ins. Three.js is built on top of WebGL, and allows you to create complex 3D scenes with a few lines of JavaScript. If your browser supports WebGL you should see a rotating Earth below: [ Fullscreen ] To be able to display something with three.js, you need three things: a scene, a camera and a renderer. var width  = window.innerWidth,     height = window.innerHeight; var scene = new THREE.Scene(); var camera = new THREE.PerspectiveCamera(45, width / height, 0.01, 1000); camera.position.z = 1.5; var rende...

Thematic Mapping Engine

It's time to introduce the Thematic Mapping Engine (TME). In my previous blog posts, I've shown various techniques of how geobrowsers can be used for thematic mapping. The goal has been to explore the possibilites and to make these techniques available to a wider audience. The Tematic Mapping Engine provides an easy-to-use web interface where you can create visually appealing maps on-the-fly. So far only prism maps are supported, but other thematic mapping techniques will be added in the upcoming weeks. The engine returns a KMZ file that you can open in Google Earth or download to your computer. My primary data source is UNdata . The above visualisation is generated by TME ( download KMZ ) and shows child mortaility in the world ( UNdata ). The Thematic Mapping Engine is also an example of what you can achieve with open source tools and datasets in the public domain: A world border dataset is loaded into a MySQL database . The same database contains tables with statistics ...

Creating 3D terrains with Cesium

Previously, I’ve used three.js to create 3D terrain maps in the browser ( 1 , 2 , 3 , 4 , 5 , 6 ). It worked great for smaller areas, but three.js doesn’t have built-in support for tiling and advanced LOD algorithms needed to render large terrains. So I decided to take Cesium for a spin. Cesium is a JavaScript library for creating 3D globes and 2D maps in the browser without a plugin. Like three.js, it uses WebGL for hardware-accelerated graphics. Cesium allows you to add your own terrain data, and this blog post will show you how. Impressed by the terrain rendering in @CesiumJS - with a 10m elevation model for Norway! Farewell Google Earth. pic.twitter.com/RQKvfu2hBb — Bjørn Sandvik (@thematicmapping) October 4, 2014 Compared to  the dying Google Earth plugin , it's quite complicated to get started with Cesium. The source code is well documented and the live coding Sandcastle is great, but there is a lack of tutorials  and my development slows down when ...