Back in May I was waiting for a geobrowser capable of showing KML in different projections. Inspired by a great blog series by Richard Marsden (1, 2, 3, 4, 5, 6 & 7!), I've done some experiments with OpenLayers and Proj4js.
Proj4js is a JavaScript library that provides methods for coordinates transformation between map projections and longitude/latitude. OpenLayers integrates with Proj4js, and by combining these libraries your able to project KML in pure JavaScript. No server side dependencies!
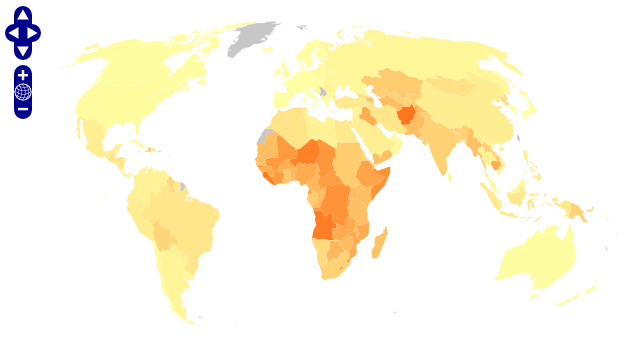
This example shows a KML document from the Thematic Mapping Engine in three different projections (Mollweide, Sinusoidal and Equal Area Cylindrical). The KML document contains borders, but these are not extracted and displayed by OpenLayers.
OpenLayers and Proj4js rocks! :-)
5 comments:
Hi Bjorn - I have come across your blogsite after searching about "dynamic content for Google Earth". We have just begun developping KLMs to put our 3D coral reef maps on Google Earth for educational purposes and to help preserve them. This is one of our KLMs:
http://bit.ly/EJkBb
What exactly is "thematic mapping"?
Also had a look at the tour for the schools - pretty cool!
Best, Stephan
stephanATbeautifuloceans.com
www.twitter.com/StephBeautifulO
Thanks for the mention!
I had to add the Cylindrical Equal Area projection to Proj4JS myself. Most of the other 'interesting' projections still need to be implemented, so the Proj4JS guys would appreciate the addition of further projections if anyone has a few hours spare time.
I also plan to write an article or two about polar projections - they'll probably be published in January.
Stephan: This PDF from Brian McManus is about thematic mapping: http://www.pop.psu.edu/gia-core/pdfs/gis_rd_05-70.pdf
Richard: Thanks for your great contribution. I would really like to have Winkel Tripel support in Proj4js. Looking forward to your new articles about polar projections!
Nice post!
I am the developer behind wdpa-marine.org that is mention on Richards article, so this is of course really great info.
There are 2 main reasons that we had for using a cylindrical projection, well mercator are:
1) We wanted to have access to the Google Imagery so you have to use their projection.
2) Maybe I am wrong, but I havent seen a map with a non cylindrical projection where you can pan over the international date line. This is not a problem if you just want to produce a map that is like a world report. But if you expect users to pan, zoom in and get to the details then this is crucial, or browsing in the pacific ocean is not possible. So to me continuos naigation from east to south is very important when you have zoomed in a bit.
Of course you could argue that then thematic mapping is not suitable for this use case, but what we tried, and did not succeed probably ;), was to integrate thematic mapping with navigation of the areas.
Somehow I think that some thematic mapping on the web could be better displayed just as a PDF instead of a mapping solution like OpenLayers. The real challenge is to make those thematic mappings also interactive and engaging.
Probably this deserves a full post on our blog.
Javier.
Hi Javier,
Thanks for your comment. I'm impressed by the work you've done on wdpa-marine.org. Nice design and I like the fullscreen option.
It's very hard to make 2-D interactive maps that can be panned and zoomed seamlessly without using a cylindrical projection. I'm sure this is the reason why mercator is still used by commercial map providers.
Post a Comment