
My last hack for making proportional symbols in KML is to use Collada objects. These objects can be loaded and scaled by using the Model element in KML. The Collada interchange file format is normally used to make 3D buildings in Google Earth, but since there is no scale restrictions they can also be used for thematic mapping. By using 3D objects, it's possible to create quite visually appealing maps.
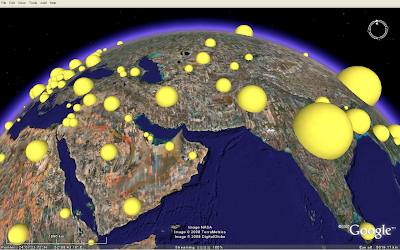 Looks like the Earth is having some sort of disease.... (download KMZ). The volume of the spheres represents the country population (source: UNdata). The sphere model was downloaded from Google 3D Warehouse, and colourised in Google SketchUp. That's the disadvantage of using models for this purpose, - it is not possible to colourise a Collada object in KML in the same way as images loaded as icons. If you want 3D symbols in different colours, you need to create different Collada objects.
Scaling is a different story, as the x, y and z axis can be scaled independently in KML. I'm using this technique to make the sphere objects population proportional.
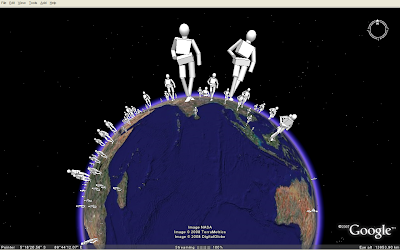 As this image (KMZ) shows, any Collada object can be used... (person from 3D Warehouse).
This was the end of my How to make proportional symbols with KML series. Please notice me if you know other techniques, or how these techniques could be enhanced!
Looks like the Earth is having some sort of disease.... (download KMZ). The volume of the spheres represents the country population (source: UNdata). The sphere model was downloaded from Google 3D Warehouse, and colourised in Google SketchUp. That's the disadvantage of using models for this purpose, - it is not possible to colourise a Collada object in KML in the same way as images loaded as icons. If you want 3D symbols in different colours, you need to create different Collada objects.Scaling is a different story, as the x, y and z axis can be scaled independently in KML. I'm using this technique to make the sphere objects population proportional.
As this image (KMZ) shows, any Collada object can be used... (person from 3D Warehouse).This was the end of my How to make proportional symbols with KML series. Please notice me if you know other techniques, or how these techniques could be enhanced!
Comments
this post if a few years old, and I was wondering if (to your knowledge) there had been any progress regarding:
(1) allowing models to be clickable (and defining ballon in klm, not in model)
(2) allowing klm to colorize models?
or alternatively:
(3) using python to create models with different colors and then link these to kml?
I'm interested in created 'blisters' representing pollutant emissions. Would like to have both volume and color represent emissions. Might either use a 'water drop' approach to add up all point sources included under a same blister (ie like water dropplets adding up to create larger drop) or have floating sphere (with smaller above larger, so that all are visible from vertical view).
Your insight would be useful!
best
Tom
I haven't looked much into collada models since I wrote this blog post.
These are my answers from what I remember, but you should check if Google has improved Collada handling in KML.
1. Not possible to have clickable collada models: http://code.google.com/p/earth-api-samples/issues/detail?id=123
2. Not possible
3. Possible! See here for PHP example.
Good luck with your project!