
I'll use the bathymetry data from NIWA to create a seafloor map of New Zealand using shaded relief techniques. I used the same techniques when I created the terrain map of Jotunheimen in Norway, so I won't go into detail here.
Let’s start by creating a color relief of the seafloor. I’ve used a blue color gradient similar to the one used by NIWA, progressing from light shallows to dark depths.
gdaldem color-relief -co compress=lzw nz-bathymetry.tif depth-gradient.txt nz-bathymetry-relief.tif

I want to enhance the view by using a couple of hillshade techniques. Let’s create a plain hillshade with gdaldem:
gdaldem hillshade -alt 60 -az 135 -co compress=lzw nz-bathymetry.tif nz-bathymetry-hillshade.tif
Notice that the light source (-az) is not from the default top left position (azimuth = 315°), but in a bottom right position (azimuth = 135°). The reason for this is that bathymetry data are inverted compared to elevation data, with higher depths having higher values.

The problem with this hillshade is that it’s all grey, and this grey color will blend with our color relief.
To enhance the hillshade we can apply another technique. This technique is described in the document “Creating Slope-Enhanced Shaded-Relief Using Global Mapper” by Kent D. Brown at Utah Geological Survey. The technique clears out the gray from low-angle slopes so the map colors are not "muddied" by shading. The document describes how to do this in Global Mapper, but we’ll try to do the same the hard way with GDAL and Mapnik.
As described in my previous blog post, creating slope shading is a two-step process. First we need to create a raster from the bathymetry data where each pixel contains an angle, varying from 0 to 90 degrees as the seafloor ranges from horizontal to vertical:
gdaldem slope -co compress=lzw nz-bathymetry.tif nz-bathymetry-slope.tif
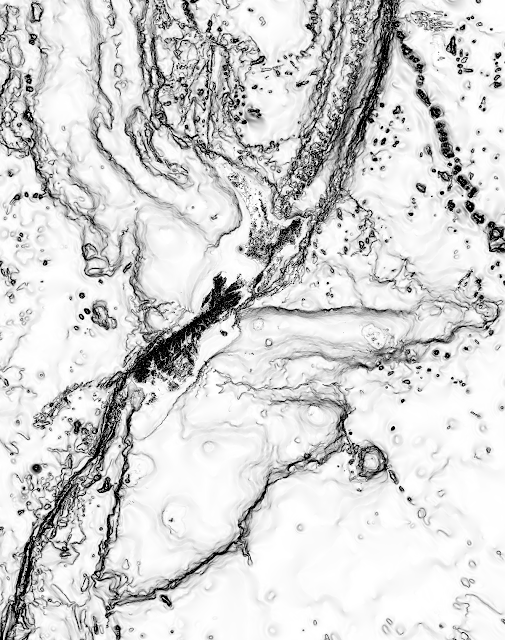
Secondly, we use this raster to slope shading by assigning a color to each pixel, using the same technique as for color relief. What we’ll do is to turn all slopes of 0° white, and any slope above 5° black. Anything in between will be in various shades of gray. Adding these two lines to the configuration file will do the trick:
We can then create slope shading with this command:
gdaldem color-relief -co compress=lzw nz-bathymetry-slope.tif slope-ramp.txt nz-bathymetry-slopeshade.tif
Next we can use Mapnik to combine the hill- and slope shade:
nik2img.py nz-bathymetry-hillslopeshade.xml nz-bathymetry-hillslopeshade.tif -d 12000 15200
Let’s start by creating a color relief of the seafloor. I’ve used a blue color gradient similar to the one used by NIWA, progressing from light shallows to dark depths.
 |
| Source: NIWA |
gdaldem color-relief -co compress=lzw nz-bathymetry.tif depth-gradient.txt nz-bathymetry-relief.tif

I want to enhance the view by using a couple of hillshade techniques. Let’s create a plain hillshade with gdaldem:
gdaldem hillshade -alt 60 -az 135 -co compress=lzw nz-bathymetry.tif nz-bathymetry-hillshade.tif
Notice that the light source (-az) is not from the default top left position (azimuth = 315°), but in a bottom right position (azimuth = 135°). The reason for this is that bathymetry data are inverted compared to elevation data, with higher depths having higher values.

The problem with this hillshade is that it’s all grey, and this grey color will blend with our color relief.
To enhance the hillshade we can apply another technique. This technique is described in the document “Creating Slope-Enhanced Shaded-Relief Using Global Mapper” by Kent D. Brown at Utah Geological Survey. The technique clears out the gray from low-angle slopes so the map colors are not "muddied" by shading. The document describes how to do this in Global Mapper, but we’ll try to do the same the hard way with GDAL and Mapnik.
As described in my previous blog post, creating slope shading is a two-step process. First we need to create a raster from the bathymetry data where each pixel contains an angle, varying from 0 to 90 degrees as the seafloor ranges from horizontal to vertical:
gdaldem slope -co compress=lzw nz-bathymetry.tif nz-bathymetry-slope.tif
Secondly, we use this raster to slope shading by assigning a color to each pixel, using the same technique as for color relief. What we’ll do is to turn all slopes of 0° white, and any slope above 5° black. Anything in between will be in various shades of gray. Adding these two lines to the configuration file will do the trick:
We can then create slope shading with this command:
gdaldem color-relief -co compress=lzw nz-bathymetry-slope.tif slope-ramp.txt nz-bathymetry-slopeshade.tif

Next we can use Mapnik to combine the hill- and slope shade:
nik2img.py nz-bathymetry-hillslopeshade.xml nz-bathymetry-hillslopeshade.tif -d 12000 15200

nik2img.py nz-seafloor.xml nz-seafloor.tif -d 12000 15200 --projected-extent 4800000 -5900000 7800000 -2100000


In my next blog post, I'll turn this image into an interactive web map.
Comments
Brent Wood
I recognize your DEM to be of positive values, right?
My sea bed DEM in use (IBCAO 3.0 http://www.ngdc.noaa.gov/mgg/bathymetry/arctic/) have negative and positive values - the negative are of most interest here.
My hillshade generation seems to be flattened for the negative areas.
What should I do in this case - I haven't found anything useful on the internet so far.
And thanks for the useful tips around.
Karl Zinglersen