
The regular polygons from my last blog post can easily be turned into bars by adding an altitude value for each vertex or corner point of the polygon. The technique is similar to the one I used for choropleth mapping (irregular polygons). In a 3D environment, I find bars or extruded polygons much more efficient than proportional symbols (2D). It is easier to spot how the statistical value changes over the surface. Let's map the digital divide:
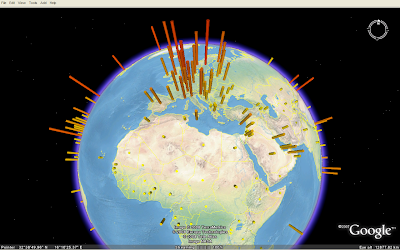 On this map (KMZ), the height and colour of the bars represents Internet users per 100 population (source: UNdata). We can clearly see the digital divide in the world. Still, because of all the "small" countries in Europe compared to other parts of the world, it is not a fair picture.
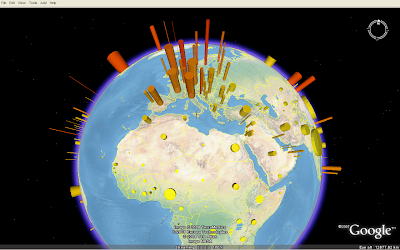 Here, I've added another variable: The bar diameter now represents the population in each country, - and the image tells a slightly different story than the image above (KMZ).
On this map (KMZ), the height and colour of the bars represents Internet users per 100 population (source: UNdata). We can clearly see the digital divide in the world. Still, because of all the "small" countries in Europe compared to other parts of the world, it is not a fair picture.Here, I've added another variable: The bar diameter now represents the population in each country, - and the image tells a slightly different story than the image above (KMZ).
Comments
Thanks for your feedback. Yes, you can add all kind of 3D models to Google Earth visualisation. They are a bit hard to create, but a lot is already available on 3D Warehouse. I could not find any nice rice plant, though.
I am completely new to KML and to thematic mapping, but I've undertaken a project that will require that I learn it fast. I'm looking at the KML file for this Digital Divide map you've done, and I think I understand what tags are doing what, but I don't understand where the data comes from. The bars are obviously scaled to the data they represent, but I don't understand how or where that scaling comes from. Moreover, I don't understand where the coordinate data for the Linear Ring tags came from? In short, I don't understand how you populate the KML files with the data. I'm sure you're a busy man, but I would appreciate any helpful thoughts you could give.
Thanks,
Kyle
Everything is described in this document.
Thank you. The document you linked was very informative, and answered many of my questions. However, it also raises some more. I would like to talk with you further regarding my project, if you can spare the time. Is there a less public forum for you and I to have a discussion? Email perhaps? You can reach me at kbagshaw@axp.flcc.edu.
Kyle